
Gold's Technicals Are Weak
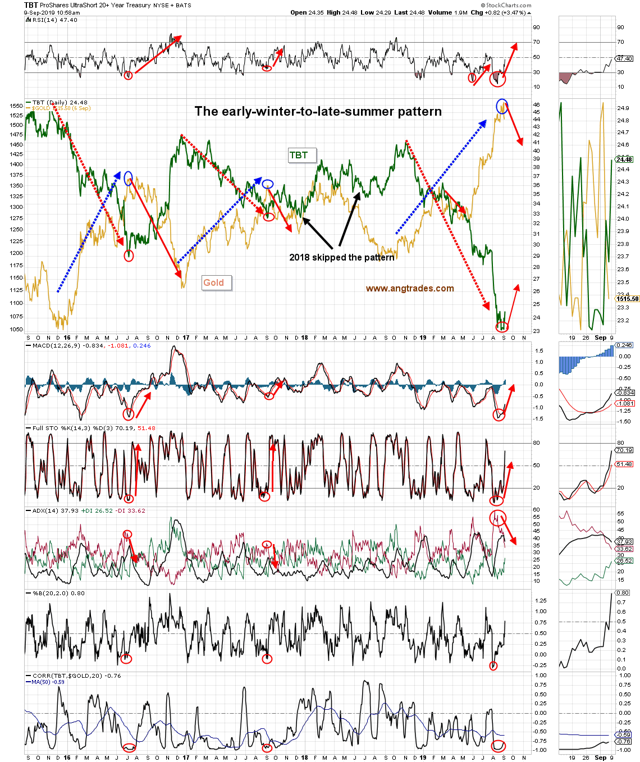
For the past three months our thesis has been that gold and bonds were being affected by the debt ceiling's restriction on the issuance of new Treasury securities, and that this shortage of Treasury securities as tier 1 assets (which banks and lending institutions need) was pushing the prices of bonds and gold (which can be used as a tier 1 asset) higher. Our thesis also stipulates that, once new Treasuries become available, the pressure on bonds and gold will diminish and their prices will fall. The latter has started to happen; in the first three days of the month, there was $71B of new Treasuries issued, and bond and gold prices have started to fall (chart below).
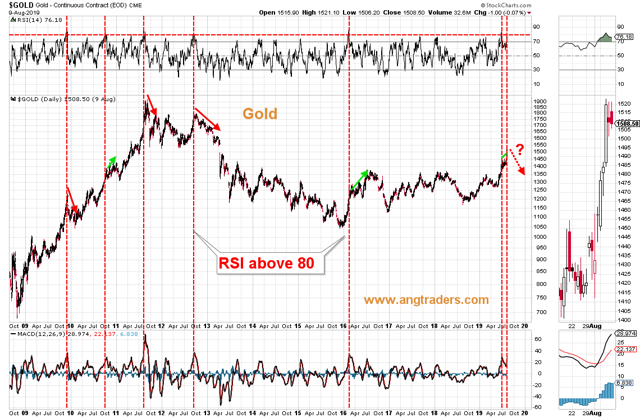
On the technical side, gold continues to be over-extended on the buy side. The chart below shows that in the past decade gold's RSI has moved above 80 six times (not counting the most recent) and half of those were followed by a drop in gold prices. That puts a drop in gold at this time in the even-odds category...at least when it comes to the RSI indicator.
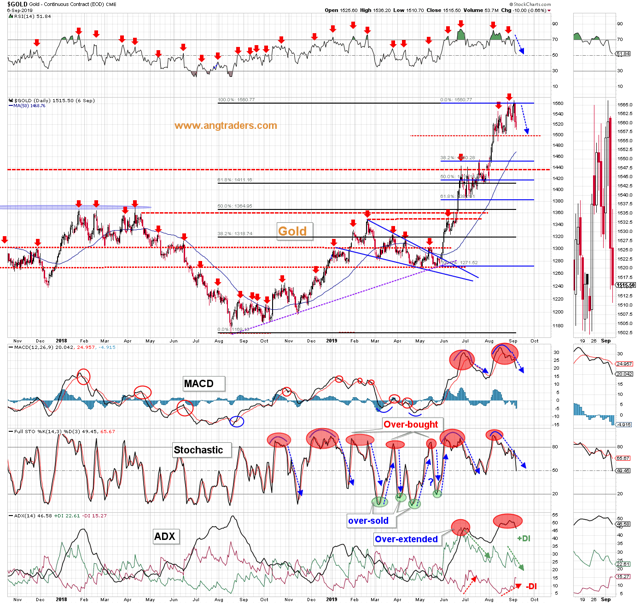
The broader technical picture for gold looks more vulnerable than the RSI does alone. There is psychological support at $1500, but no technical support until the $1450-$1440 level (chart below).
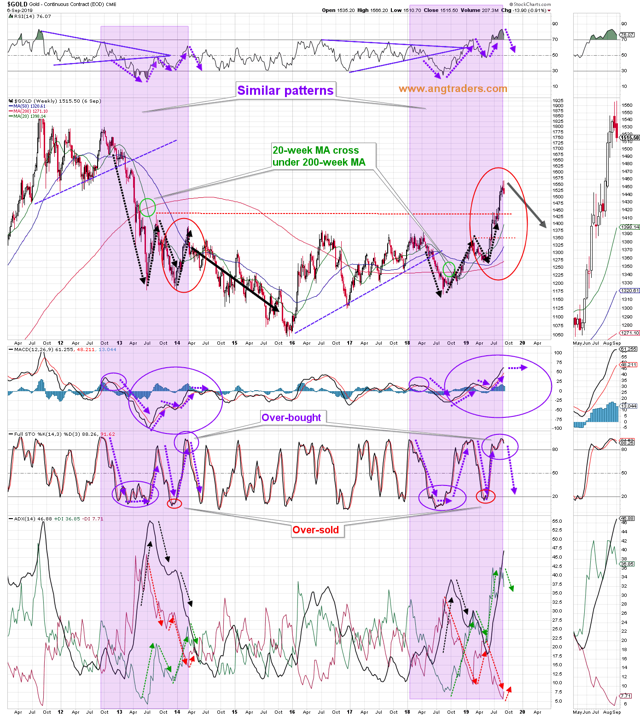
In October 2013 the government shut down and gold shot higher soon afterward. We are now seeing a similar (not exact) pattern in the technicals of gold as in 2013-14. If this pattern continues to replicate, we can expect the price of gold to drop in the next couple of months (chart below).
The HUI Gold Bugs index and the Gold Miners Percent Bullish index, are both replicating the bearish pattern from 2016 (dashed blue arrows below). This implies weakness in the mining equities (chart below).

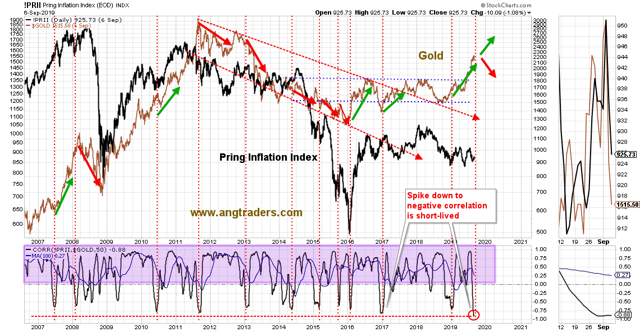
The Pring Inflation index has a strong positive correlation with the price of gold. Down-spikes into negative correlation are short-lived; both the Pring and gold return to moving in the same direction. The current down-spike is the deepest that has occurred in the last 13-years (red-oval below). Either the Pring Inflation index starts moving up, or gold starts moving down. Since we do not expect inflation to be an issue for the time-being, we predict that the gold price will drop (chart below).
The price of gold will be lower in the next few weeks as new Treasuries are issued to cover the increased deficit spending.


