Gold’s Push Hits Stop, Fed Preps Rate Pop, S&P Set To Flop

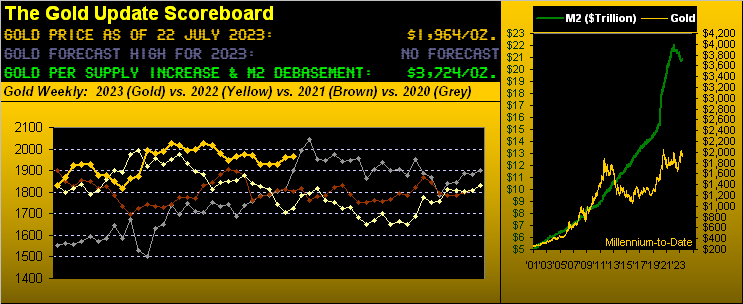
Quite the trifecta in our title: Gold, the S&P and the Fed all well in play for the week ahead.
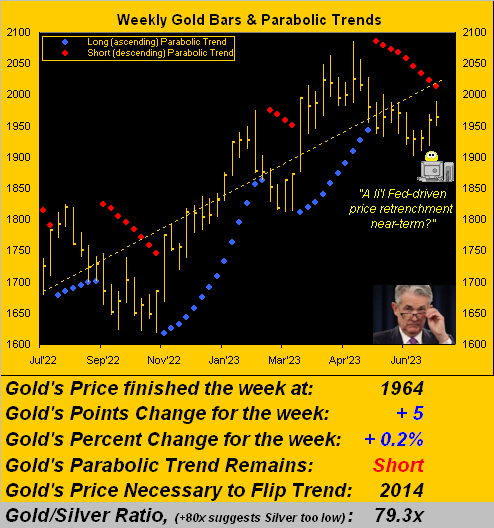
And straightaway we start with Gold — which considering ’tis still within its Short trend — had nonetheless been firming well of late, price having proceeded from 1901 to 1990 across just 15 trading days. Indeed just a week ago we mused that given Gold’s expected ranginess, price could flip such Short trend to Long basically by month’s end. Quantitatively that’s still in play as we turn to Gold’s weekly bars from a year ago-to-date, the rightmost re-dotted parabolic Short trend having completed its ninth week in duration. Given the yellow metal’s having settled the week yesterday (Friday) at 1964, the upside distance to the trend’s “flip price” at 2014 is precisely 50 points — which whilst a stretch with but six trading days left in July — is “reachable” as Gold’s expected weekly trading range is now 54 points:
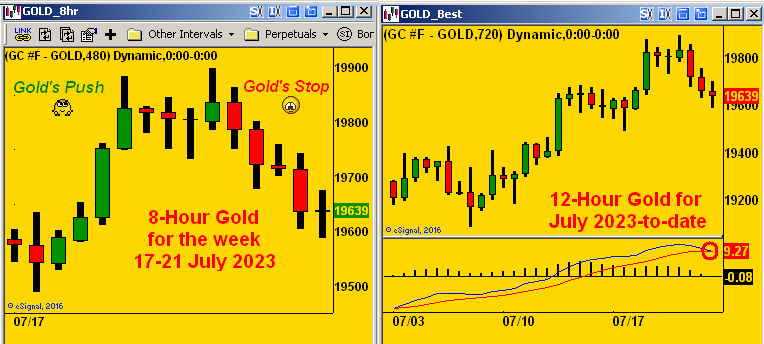
However: in that vein, this past week saw Gold’s prodigious push hit a sudden stop on Thursday, well-exemplified by the following two-panel graphic. On the left we’ve Gold’s past week as charted by 8-hour candles, wherein we see the “push” suddenly morph into the “stop”. On the right we’ve Gold’s month-to-date view as charted by 12-hour candles, the key there being the lower panel’s MACD (“moving average convergence divergence”) provisionally making a negative cross as encircled:
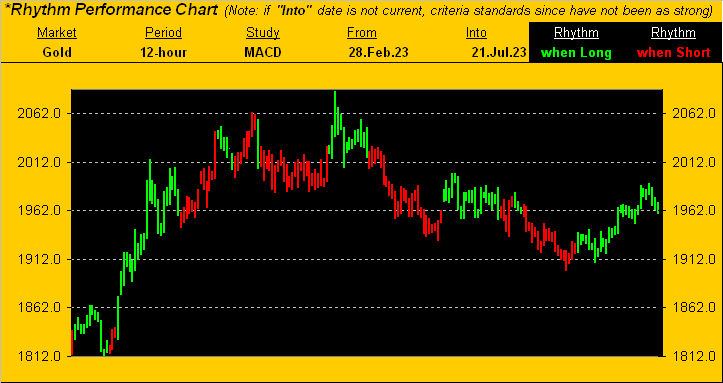
And specific to that negative MACD crossing, such study at present lists as our best “Market Rhythm” for Gold, as direct from the website’s “Gold” page comes the next chart. ‘Tis the price of Gold again by 12-hour bars, but this time from as far back as 28 February-to-date: when the bars are green, the MACD is in positive mode; when they are red, the MACD in negative mode; and the next bar to paint shall be in red upon Monday’s commencement of trading. ‘Course, hardly are MACD designations perfect, for as is the case with conventional technical studies, they are behind the curve, albeit directionally helpful should price continue to actually “go somewhere” as you can see:
“But is this negative 12-hour MACD really that damaging to the price of Gold, mmb?“
Actually ’tisn’t, Squire. But it does give us an idea of how low Gold may go before price resumes northward. The past eight negative MACD crossings saw price fall by an “at most median” of -20 points or by an “at most average” of -30 points. Soley in that vacuum, with price today at 1964, such suggestion is we can thus see the 1940s-to-1930s near-term … which for the long (indeed eternal)-term Gold-holder is mere “noise”. The point is: be thee not discouraged by perhaps a week of price retrenchment as the Federal Reserve rears its rate hike head come Wednesday (26 July).
Yes, the Federal Reserve’s Open Market Committee is preparing for another +0.25% FedFundsRate pop. As we’ve previously opined, we doubt such desire to raise shall be thwarted by the recent perception that inflation is slowing: recall that June’s CPI rate rose to +0.2% from +0.1% in May, whilst that for the PPI rose to +0.1% from -0.4% (i.e. deflation). Fairly acknowledged however, both measures via 12-month summations are declining. But: this is the Fed and ’tis in their head to go with Core Personal Consumption Expenditure Prices, which when last reported for May were running at nearly double the Fed’s desired annualized +2% rate … and which for June shan’t be reported until two days (28 July) following these next Fed Follies (26 July), lest we not also overlook the first peek a Q2 GDP on Thursday (27 July). Thus following those two post-Fed vital reports, we’ll have “nuthin’ but Fed” through the FinMedia thread right into the FOMC’s 20 September Policy Statement: you know, “Can the Fed reverse this market crash?” and so forth. (Keep reading).
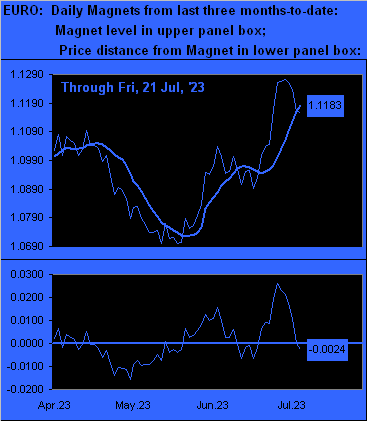
And “conventionally”, both Gold and the Dollar are sensitive to Fed interest rate moves. Moreover, we’re already seeing it. As comprehensively detailed above, Gold appears poised to retrench just a bit. For respect to the Dollar, it tends to get a bid given an increased rate of interest. Which is why from the website’s “€uro” page, we see that currency (similar to Gold’s healthy run of late) having just now penetrated down through our “Market Magnet”, a leading event that perceives lower levels near-term, (i.e. the Dollar gaining back ground against the €uro). To wit the graphic of the €uro (thin line) across the past three months-to-date displaying the rightmost downside penetration of its Magnet (thick line). See how the Fed can making trading fun? (If you “know” in advance what’s to come):
As to what’s to come for the S&P, hardly do we see it as pretty. Rather ’tis primed to flop. Yes, of course there’s its massive overvaluation, the S&P 500 today at 4536, its “live” price/earnings ratio having settled the week at 57.5x. And ’tis not getting much help from Q2 Earnings Season: thus far with 71 constituents having reported, just 56% have improved their bottom lines from a year ago (when the mighty Index was 3962 and the “live” p/e then “only” 31.6x). What does that say about Earnings relative to Price? Uh-oh…
But wait, there’s more. As we tweeted (@deMeadvillePro) last Thursday: “S&P only -0.7% today (Thu) but the MoneyFlow drain was the most for any one day since 13 Sep ’22. Suggests near-term top is in place.” The S&P was buffered Thursday by a spritely Dow, (i.e. that Index at which our parents used to look). But the S&P’s negative MoneyFlow — a favoured leading indicator — was massive as dough poured from these 10 constituents: Telsa (TSLA), Nvidia (NVDA), Microsoft (MSFT), Amazon (AMZN), Apple (AAPL), “Faceplant” (META), Netflix (NFLX), Advanced Micros Devices (AMD), and both tranches of Alphabet (GOOGL and GOOG).
Moreover, do you remember what happened from last year’s noted autumnal day of like massive MoneyFlow negativity? From the following day’s high, the S&P careened -393 points (-10%) in a mere 20 days. And now here we are again. Such fact hasn’t made it through the FinMedia — their focus being on “how the S&P makes a new high” — but as usual, ’twill become apparent well after the selling has kicked into gear. Or if all of this is too complex for you WestPalmBeachers down there, as of yesterday’s close, the S&P concluded its 34th day as “textbook overbought”. That is akin to nearly falling off the edge of the Bell Curve. Reprise with emphasis: Uh-oh…
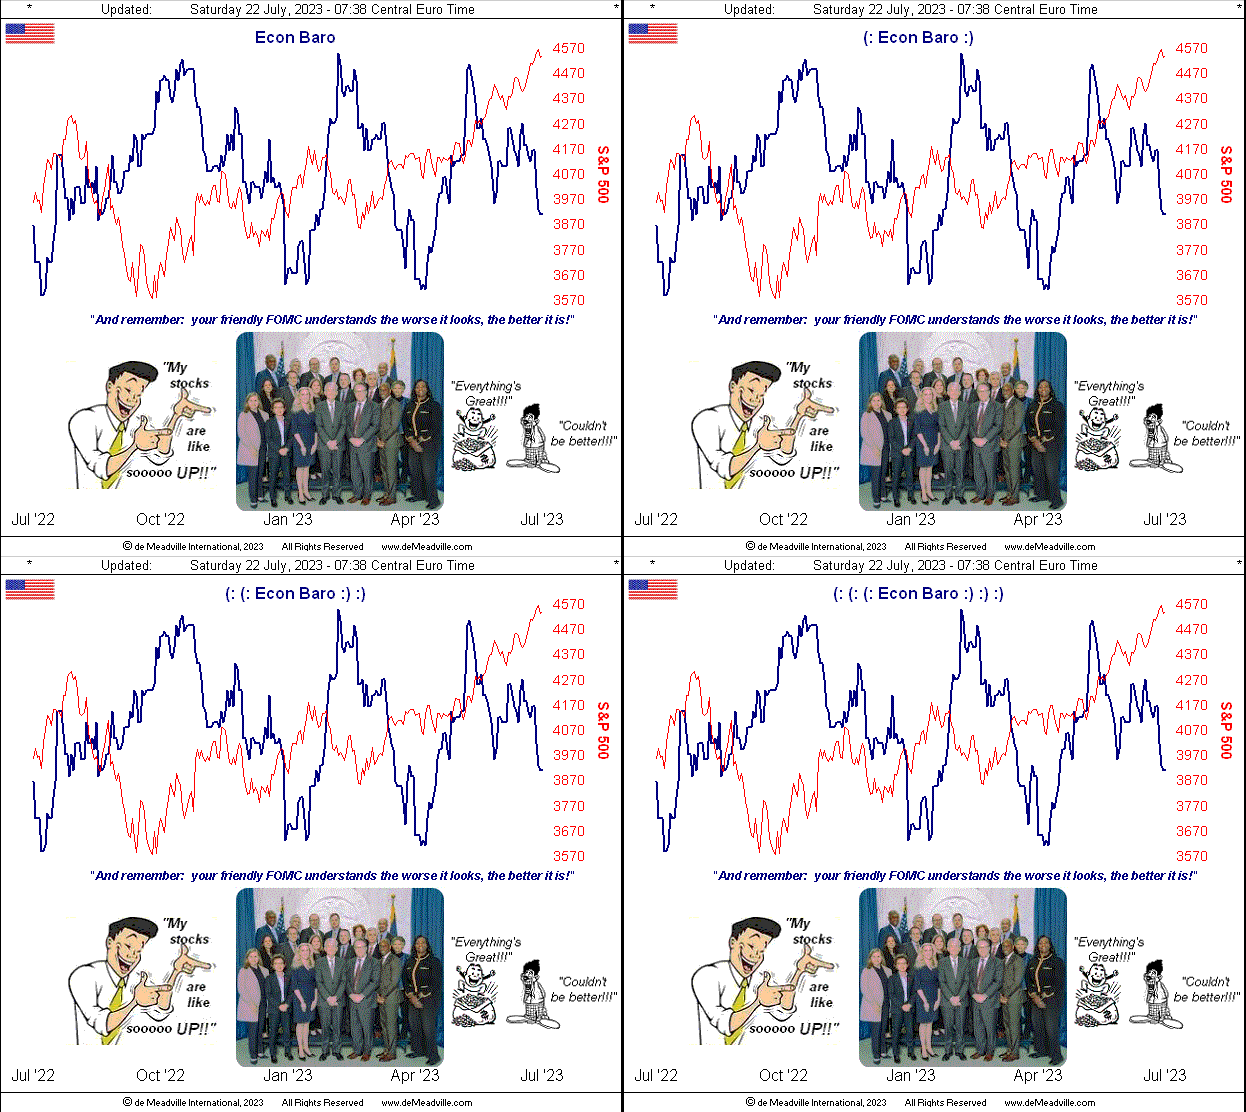
Then there’s the tried-and-true Economic Barometer, which as you long-time readers know from its inception back in 1998 led stock market direction for some 22 years until the Fed’s distortions of the StateSide money supply in the name of COVID essentially made the S&P unilaterally rise despite meager growth in both the economy and earnings. That cited, the divergence now between the Baro and the S&P 500 is becoming somewhat startling:
The good news of course is that “everybody knows” the stock market never goes down in summertime, (the exceptions being the S&P 500’s double-digit percentage “corrections” during the summers of ’74, ’75, ’81, ’90, ’01, ’02, ’07, ’08, ’11, ’15 and ’22). Might we press you to another cucumber sandwich and lemonade?
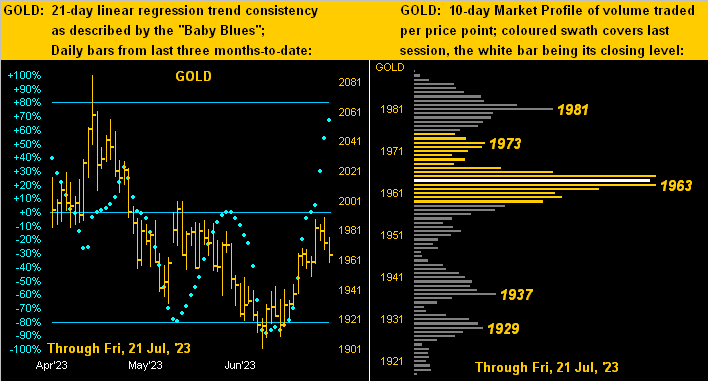
Pressing a bit is this next two-panel view of Gold, its daily bars from three months ago-to-date on the left and 10-day Market Profile on the right. The rising baby blue dots of trend consistency are as firm as ever, but to remain so, price has to stay on its upside go, else see them kink lower as you know. And present price in the Profile says it all, that 1965-1963 apex now the support/resistance wall:
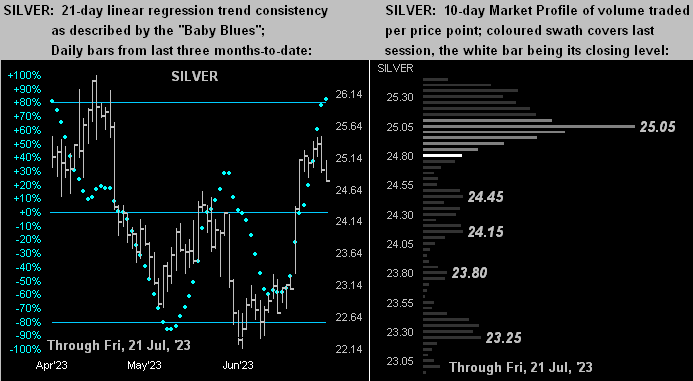
Similar yet again is the picture for Silver, her “Baby Blues” (at left) having just eclipsed the key +80% level but with a bit less puff, whilst 25.05 in the Profile (at right) appears more resistive in our sight, with present price 24.78 having slipped a mite:
So quite a lot there to digest from this week’s missive, with material we trust you find useful if unavailable anywhere else. And speaking of anywhere, a lot is on table for all of our BEGOS Markets (Bond, Euro/Swiss, Gold/Silver/Copper, Oil, S&P 500) as these next days unfold, the FOMC’s Wednesday’s rate hike certainly to play into the mold. But you know what monetarily to love and hold: Gold!

Cheers!
…m…
More By This Author:
Gold Garners Glow, Stocks Go WhackoGold’s Downtrend Duly Dissed, Stocks’ 10 Crash Catalysts
Happy Mid-Year Finds Gold Up A Gear
Disclaimer: If ever a contributor needed a disclaimer, it's me. Indeed, your very presence here has already bound you in the Past, Present and Future to this disclaimer and to your acknowledging ...
more


