
Gold price is treading water just below $1,800, as investors fail to find a clear directional impetus amid a broadly weaker US Dollar and higher Treasury bond yields. The US Dollar is feeling the pull of gravity, dragged down by the USD/JPY sell-off while the US Treasury bond yields benefit from hawkish comments from the Cleveland Fed President Loretta Mester. Despite the hawkish Fed outlook, Gold price is looking to extend the renewed upside, underpinned by the bullish technical setup and encouraging news from India. Last week, India’sgovernment raised the base import prices of crude palm oil and soy oil, gold and silver, as prices jumped in the world market. Investors will closely follow the US Dollar price action and risk trends amid a relatively quiet start to the Christmas week.
Gold Price: Key levels to watch
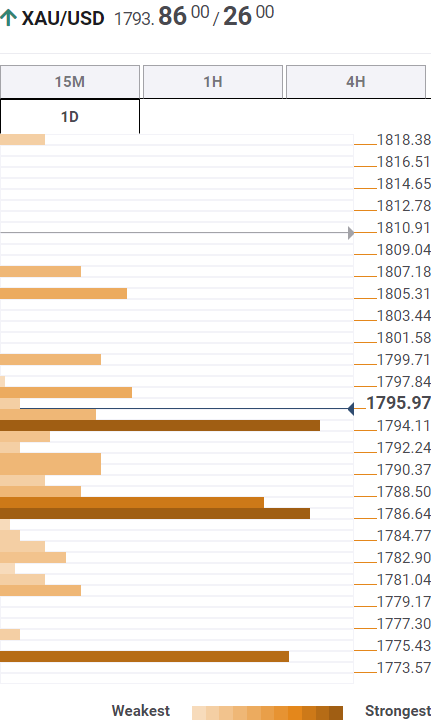
The Technical Confluence Detector shows that the gold price is gathering strength to yearn for a decisive break above the powerful resistance aligned at $1,795. That level is the convergence of the SMA5 one-day, Fibonacci 38.2% one-week and the previous high four-hour.
If bulls manage to find a strong foothold above the latter, then a minor resistance at $1,798 will be tested. The next stop for Gold bulls is seen at the pivot point one-day R1 at $1,800.
A fresh advance toward the Fibonacci 61.8% one-week at $1,805 could be in the offing on a sustained buying.
On the downside, strong support awaits at around $1,787, the intersection of the Fibonacci 38.2% one-day, SMA200 one-day, the previous month’s high and the Fibonacci 23.6% one-week.
A breach of the latter will expose the Fibonacci 61.8% one-day at $1,783. Further south, the pivot point one-day S1 at $1,780 could come to the rescue of Gold buyers.
Here is how it looks on the tool
(Click on image to enlarge)
About Technical Confluences Detector
The TCD (Technical Confluences Detector) is a tool to locate and point out those price levels where there is a congestion of indicators, moving averages, Fibonacci levels, Pivot Points, etc. If you are a short-term trader, you will find entry points for counter-trend strategies and hunt a few points at a time. If you are a medium-to-long-term trader, this tool will allow you to know in advance the price levels where a medium-to-long-term trend may stop and rest, where to unwind positions, or where to increase your position size.
More By This Author:
GBP/USD Bulls Attack 1.2200 Despite Mixed Feelings For Britain, Focus On UK GDP, Fed’s Preferred Inflation
AUD/USD Struggles Around 0.6700 Amid Hawkish Fed Comments, RBA Minutes Eyed
AUD/USD Price Analysis: Struggles At The 20-Day EMA, Drops Below 0.6700


Comments
Log in or sign up to join the conversation.