
- Risk aversion weighed on high-beta currencies like the Australian Dollar.
- Global central banks hiking rates and eyeing additional increases sounded recession alarms, dampening investors’ mood.
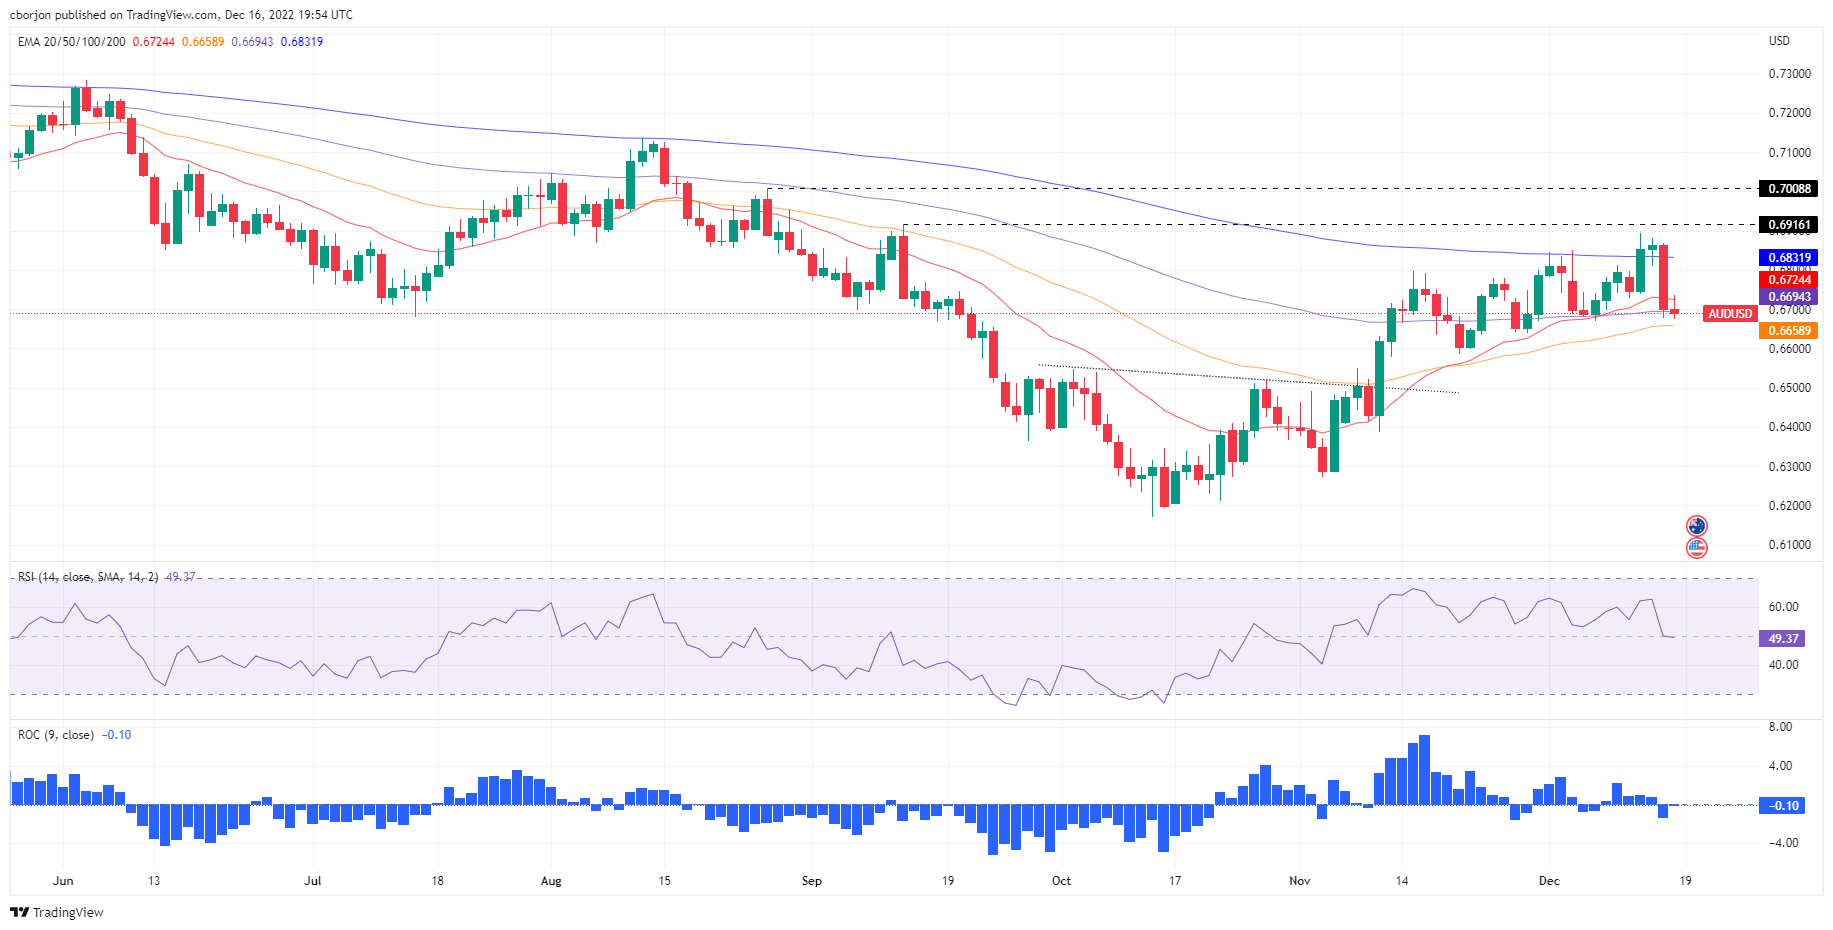
- AUD/USD Price Analysis: Downward biased, after tumbling from weekly highs, heading to the 50-day EMA.
The Australian Dollar (AUD) slides against the US Dollar (USD) amidst a dampened market sentiment as an economic slowdown looms, after a central bank bonanza, featuring the US Federal Reserve (Fed), the Bank of England (BoE), and the European Central Bank (ECB) raising rates by 50 bps each. Additionally, policymakers emphasized the need to do what’s needed to tackle inflation, which keeps investors uneasy. Therefore, the AUD/USD is trading at 0.6690, below its opening price.
AUD/USD Price Analysis: Technical outlook
After Thursday’s drop from around 0.6870 toward 0.6670, the AUD/USD is poised for a deeper correction. Market sentiment, and technical factors led by buyers unable to decisively clear the 200-day Exponential Moving Average (EMA) at 0.6831, exacerbated the Aussie Dollar’s fall toward current exchange rates. On its way south, the AUD/USD cleared the 20-day EMA at 06724, which halted Friday’s upside, as the AUD/USD is set to finish the week with losses of 1.60%.
Furthermore, a break below December 15 swing low at 0.6676 could exacerbate the AUD/USD’s fall toward the 50-day EMA at 0.6658, accelerating the downtrend to the 0.6600 mark. Oscillators like the Relative Strength Index (RSI) crossed to bearish territory, while the Rate of Change (RoC), is headed to the downside, cementing the case for a deeper correction.
As an alternate scenario, if the AUD/USD reclaims the 0.6700 mark, a test of the 200-day EMA at 0.6831 is on the cards. A breach of the latter will expose 0.6916 September’s 13 high, followed by the 0.7000 psychological mark.
(Click on image to enlarge)
sAUD/USD Key Technical Levels
AUD/USD
| OVERVIEW | |
|---|---|
| Today last price | 0.6686 |
| Today Daily Change | -0.0017 |
| Today Daily Change % | -0.25 |
| Today daily open | 0.6703 |
| TRENDS | |
|---|---|
| Daily SMA20 | 0.6738 |
| Daily SMA50 | 0.6552 |
| Daily SMA100 | 0.6673 |
| Daily SMA200 | 0.6899 |
| LEVELS | |
|---|---|
| Previous Daily High | 0.687 |
| Previous Daily Low | 0.6677 |
| Previous Weekly High | 0.6851 |
| Previous Weekly Low | 0.6669 |
| Previous Monthly High | 0.6801 |
| Previous Monthly Low | 0.6272 |
| Daily Fibonacci 38.2% | 0.675 |
| Daily Fibonacci 61.8% | 0.6796 |
| Daily Pivot Point S1 | 0.663 |
| Daily Pivot Point S2 | 0.6557 |
| Daily Pivot Point S3 | 0.6437 |
| Daily Pivot Point R1 | 0.6823 |
| Daily Pivot Point R2 | 0.6943 |
| Daily Pivot Point R3 | 0.7016 |
More By This Author:
EUR/GBP Prolongs The Post-ECB Rally, Climbs To One-Month High Around 0.8770 RegionWTI Price Analysis: Bears Eye A Break Of $75.70 For The Sessions Ahead
USD/JPY Price Analysis: Bulls And Bears Await The Fed, The Lines Are Drawn


Comments
Log in or sign up to join the conversation.