
Gold Our Best Vertex, S&P Train Wrecks

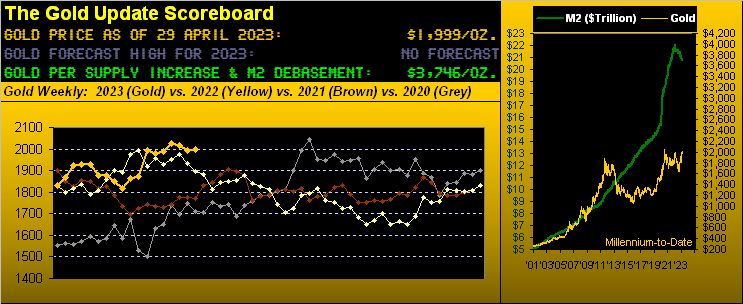
We’ve completed the year’s first trading quadrimestre (a little French lingo there). And just as we saw at March’s month-end, so too through April is Gold again sporting the highest year-to-date percentage BEGOS Markets vertex as the ![]() “The Leader of the Pack”
“The Leader of the Pack”![]() –[The Shangri-Las, ’64]:
–[The Shangri-Las, ’64]:
And contrary to conventional wisdom that Gold and the stock market are inversely correlated, barely off the pace is the S&P 500 in second place, with the reportedly “left for dead” U.S. 30-year Treasury Bond rounding out the podium.
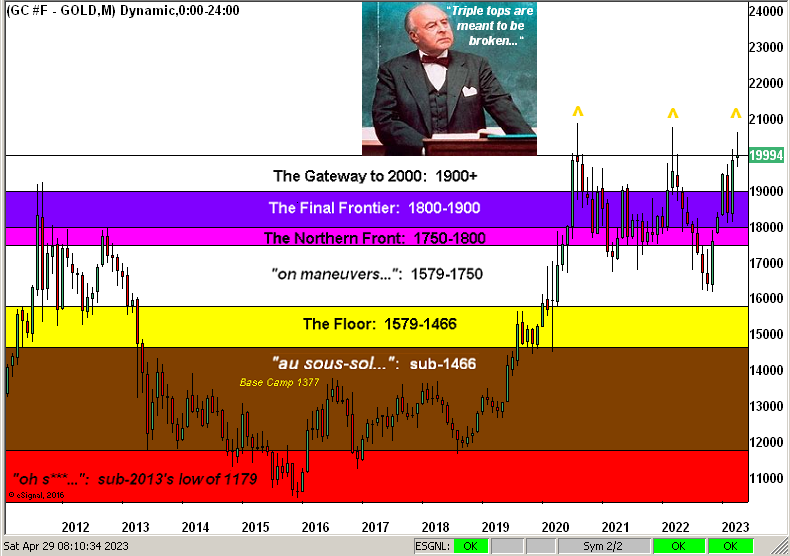
Still, specific to the yellow metal through these last three missives inclusive, we continue to anticipate a new Gold All-Time High as nigh — albeit having fully expected en route some near-term retrenchment into the 1900s — which has been exactly the case thus far. (Note that per reader requests, recent editions of The Gold Update are now being archived on the website, such that you can look back to see what we’ve said).
To be sure, in yesterday’s (Friday’s) settling of the week, (and month and quadrimestre) at ![]() “1999”
“1999” ![]() –[Prince, ’82], ’tis but a 90-point sprint to the present All-Time High (of 2089 back on 07 August 2020), which as herein detailed a week ago can happen in a heartbeat.
–[Prince, ’82], ’tis but a 90-point sprint to the present All-Time High (of 2089 back on 07 August 2020), which as herein detailed a week ago can happen in a heartbeat.
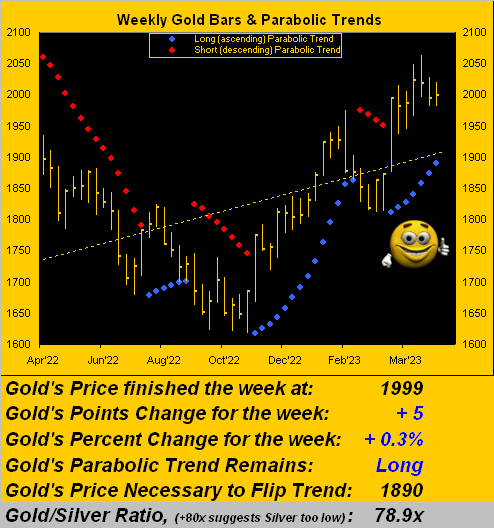
But in looking ahead toward Gold’s inevitably passing up through 2089, again we’re anticipating the mid-2100s come this July, given typical price gains during parabolic Long trends. The current one is represented by the rightmost ascending blue dots across Gold’s weekly bars from one year ago to date, (with the flip for the ensuing week still well out of range down there at 1890):
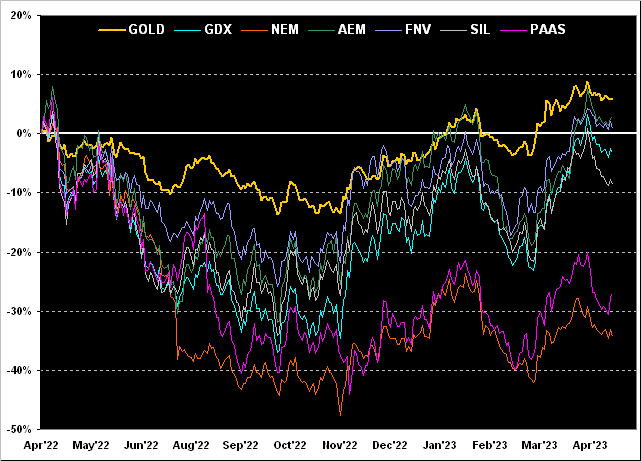
Now as we turn to “The Gold Leverage Dept.” as well from one year ago to date, Gold itself has the best performance track of the whole bunch. Thus is Gold too far ahead of the pack? Hardly, given today’s 1999 being but 53% of the opening Scoreboard’s debasement valuation of 3746. Rather, we see Gold’s equities brethren having a lot of catching up to do. At present, their year-over-year percentage tracks with Gold +6% are Agnico Eagle Mines (AEM) +3%, Franco-Nevada (FNV) +1%, the VanEck Vectors Gold Miners exchange-traded fund (GDX) -3%, the Global X Silver Miners exchange-traded fund (GDX) -9%, Pan American Silver (PAAS) -27%, and S&P 500 constituent Newmont (NEM) -34%. Livin’ for leverage? Lovin’ these laggards!
But it depends from where you measure, right mmb?
An absolutely valid point there, Squire. For example, if measuring from the Opening Bell that began the year 2016 when Gold & Co. were deep in the dumper, almost all of these cited equities have outpaced Gold. Since then: FNV is +227%, PAAS is +167%, NEM is +157%, GDX is +138%, AEM is +110%, Gold itself is +88%, and the lone underperformer is SIL +58%. Regardless, ’tis time for the equites to again get on the go, the ideal catalyst being upon Gold eclipsing 2089 for a new All-Time High. Then watch ’em really go!
And speaking of stocks in general, to again reprise the late great football coaching legend Vince Lombardi: “What the hell’s goin’ on out there?!?!?” After all, our missive’s title for this week includes “S&P Train Wrecks” of which we’ve selected several to inspect. In fact, let’s present them as follows in a form most picturesque:
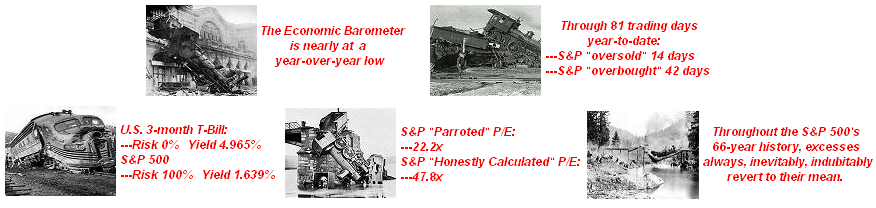
Talk about taking the wrong track … yet the stock market per our preferred measure of the S&P 500 (currently 4169) refuses to revert to rational valuation (sub-3000, at least). Indeed as Q1 Earnings Season continues to unfold, of the 249 constituents having reported, a full 40% have posted worse bottom lines than for Q1 of a year ago. Is it any wonder our “live” price/earnings ratio for the S&P remains in rarefied air at 47.8x up there? Recall Jerome Cohen’s writing that “…in bull markets the average level would be about 15 to 18 times earnings…” Still in today’s S&P there are 28 constituents with P/Es of 100x or greater … and hardly is this even a “bull market”. Let’s cue Dire Straits from back in ’85 with ![]() “Why Worry?”
“Why Worry?” ![]() After all, have a gander at the Economic Barometer:
After all, have a gander at the Economic Barometer:
Indeed the Baro’s “low-light” for the week was Q1’s shrinkage in annualized real Gross Domestic Product growth to just +1.0%. Too, The Conference Board’s April reading on Consumer Confidence stumbled as did both March’s Personal Spending and Pending Home Sales. But there were a few bright spots to give the Baro a bit of a lift, notably from the Chicago Purchasing Managers’ Index leap for April along with March’s Durable Orders and New Home Sales; also, Initial Jobless Claims subsided. But on balance across the breadth of the Baro, the economy at best is shaky and faltering.
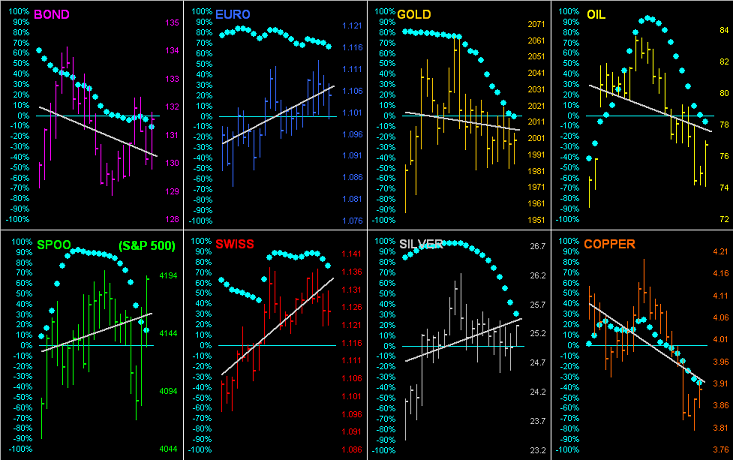
Faltering too of late are the BEGOS Markets as next we go ’round the horn for all eight components across their daily bars for the past 21-trading days (one month). Note that in every case, the baby blue dots of regression trend consistency are in decline; moreover, just seven trading days ago, each market’s grey trendline was positive, four having since rotated to negative. And specific to the S&P 500 (lower left panel) we sense that rightmost spike is a one-time wondershot: in our book, just because a slowing economy suggests a Federal reserve “pivot”, ’tis poor judgement to knee-jerk purchase equities without regard to extreme overvaluation; and at the end of the day, earnings beating “estimates” doesn’t cover the reality of earnings in decline, (again as is the case this Earnings Season for 40% of the S&P’s constituents). Here’s the graphic:
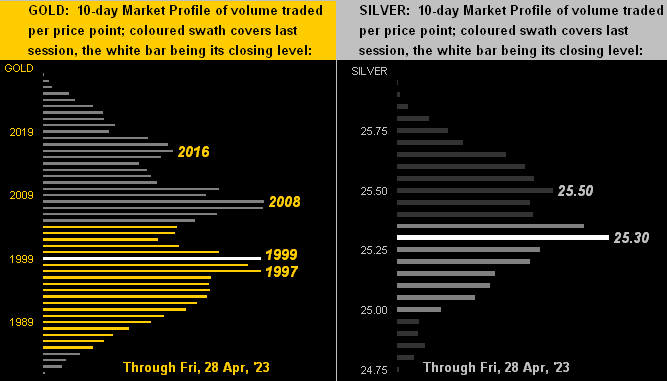
Next we turn to the 10-day Market Profiles for the precious metals. And for both Gold on the left and for Silver on the right, present price (the respective white line in each panel) is poised mid-profile, both near if not at their most heavily traded prices as labeled for the past two weeks. Perhaps a re-gripping to go for Gold’s high:
Thus toward wrapping it up with one-third of 2023 in the books, here we’ve Gold’s stratified structure by price’s monthly bars from the year 2011-to-date. Dare we say: “Here’s Johnny…” reminding us that a new All-Time Gold High is nigh:
So into this year’s second quadrimestre we go. With the StateSide debt ceiling rising (but dead on arriving?), banks not surviving, Wednesday’s Fed hike reviving and the ensuing week’s 14 incoming Econ Baro metrics (to resume diving?), in whose car do YOU prefer to be driving? That of GOLD! The Leader of the Pack!
Cheers!
…m…
More By This Author:
A Time To Add To One’s Gold StackGold: The Next All-Time High is Nigh
Gold Flies As Fin Is In
Disclaimer: If ever a contributor needed a disclaimer, it's me. Indeed, your very presence here has already bound you in the Past, Present and Future to this disclaimer and to your acknowledging ...
more

