Global Asset Allocation Update
Markets have moved sharply over the last month, mostly in the post-election period. Stocks are up – small caps exuberantly so – the dollar is up, bonds and gold are down. Surprisingly though, our indicators did not move all that much. The direction of change in the indicators is consistent with the moves in assets but not the magnitude. The yield curve, for instance, did steepen in response to the election but the change in growth and inflation expectations has been fairly minor (33 basis points). Even considering the potential for corporate tax changes, the 11% move in small cap stocks seem a bit, well, irrational. These moves are being attributed to the new administration’s potential policy changes but I think it is important to note that directionally these moves were already in progress. Bond yields were already rising, the yield curve already steepening, gold already correcting. What changed with the election was the rate of change.
I don’t make portfolio changes based on politics but the change in our indicators – no matter the cause – does warrant some changes. For the moderate risk investor, the allocation between bonds and risk assets shifts to 50/50, eliminating our cash position.
(Click on image to enlarge)
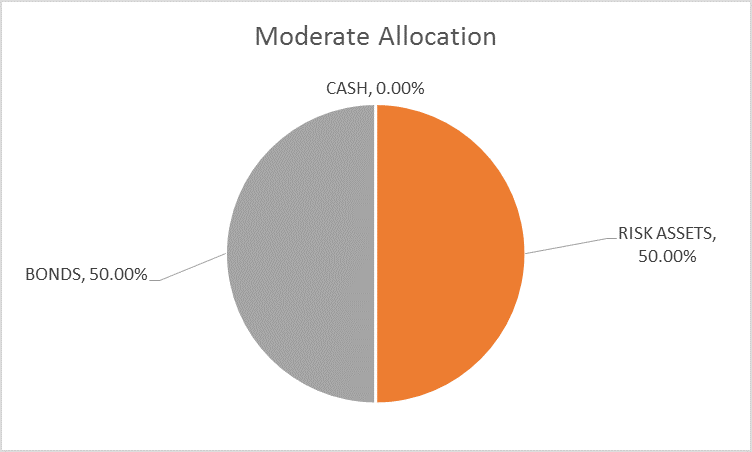
The change in the risk budget is, like the change in our indicators, fairly small. I do not believe it is appropriate to make big changes based on potential changes in economic policy. While we can see a general outline of the Trump administration’s policies – some of which I like quite a lot – we do not yet know the details. And those details are important. Furthermore, some of the proposed policies may not be as positive for stocks as those charging into the market seem to assume. Trade policy – as outlined on the campaign trail – in particular could be very negative for corporate profits and therefore stocks. In addition, threatening tariffs sends a very negative signal about the dollar. Labeling China as a currency manipulator is tantamount to telling the world you’d like a cheaper dollar – and I would note that Presidents generally get the dollar they ask for. That has implications for commodities, gold, interest rates and not least the effectiveness of his other proposed policies. Tax cuts and a weak dollar are not very effective; just ask George W. Bush.
Economic growth, as I’ve said many times, is a function of just two things – population (workforce) growth and productivity growth. The incoming administration is hostile to immigration – or at least that is the perception – so the only option on the first one is to get the economy growing fast enough to raise the participation rate. Demographics would seem to be working against us in that regard but I suppose it is possible. Where the new administration could have a big impact is on the second item – productivity growth. Cutting the corporate tax and the capital gains tax should be a positive for investment and therefore productivity growth. I would caution the bulls though to consider that companies have had ample profits and opportunity to invest the last seven years and have instead chosen to engage in financial engineering – stock buybacks and the like. And don’t count on a tsunami of corporate cash coming back from overseas either. Large companies – where most of the offshore cash lies – can bring that money home now and still avoid the tax. If you doubt that, remember that Apple floated several bond issues the last few years to do exactly that – and used the proceeds to buy back stock. In any case, any impact from changes to tax policy will take time to be reflected in the economic statistics and we don’t even know yet what will eventually emerge from the sausage factory known as the US Congress.
I am also concerned about the budget implications of the proposed policies. Our “secular stagnation” is a debt problem and it seems unlikely we will solve it by running larger deficits. US federal debt has doubled over the last eight years and Corporate America has been busy leveraging its balance sheet to buy back stock and pay dividends to ramp up stock prices. Deleveraging is myth. Japan has spent the last thirty years running up more debt in an effort to raise growth and it just hasn’t worked. Maybe we should ask them how all that infrastructure spending has worked out. I would also point out to all the newly minted infrastructure experts that the proposed policy amounts to only $100 billion per year. That will not move the growth needle in an $18.6 trillion economy. Besides, we already copied their failed QE policy to little effect. Do we have to repeat all Japan’s mistakes of the last three decades?
No matter my views on the effectiveness of the incoming administration’s policies, I will let the market be my guide when it comes to asset allocation. The market is not infallible but it is a much better forecaster than I or anyone else. Right now, our market indicators are pointing to a mild upturn in growth and we will respond with some mild asset allocation changes. If the policy mix that finally emerge from the new administration is positive it will be reflected in the market and we’ll change with it. But it does not seem prudent to get ahead of reality. He hasn’t even taken the oath of office yet for goodness sakes.
Indicator Review
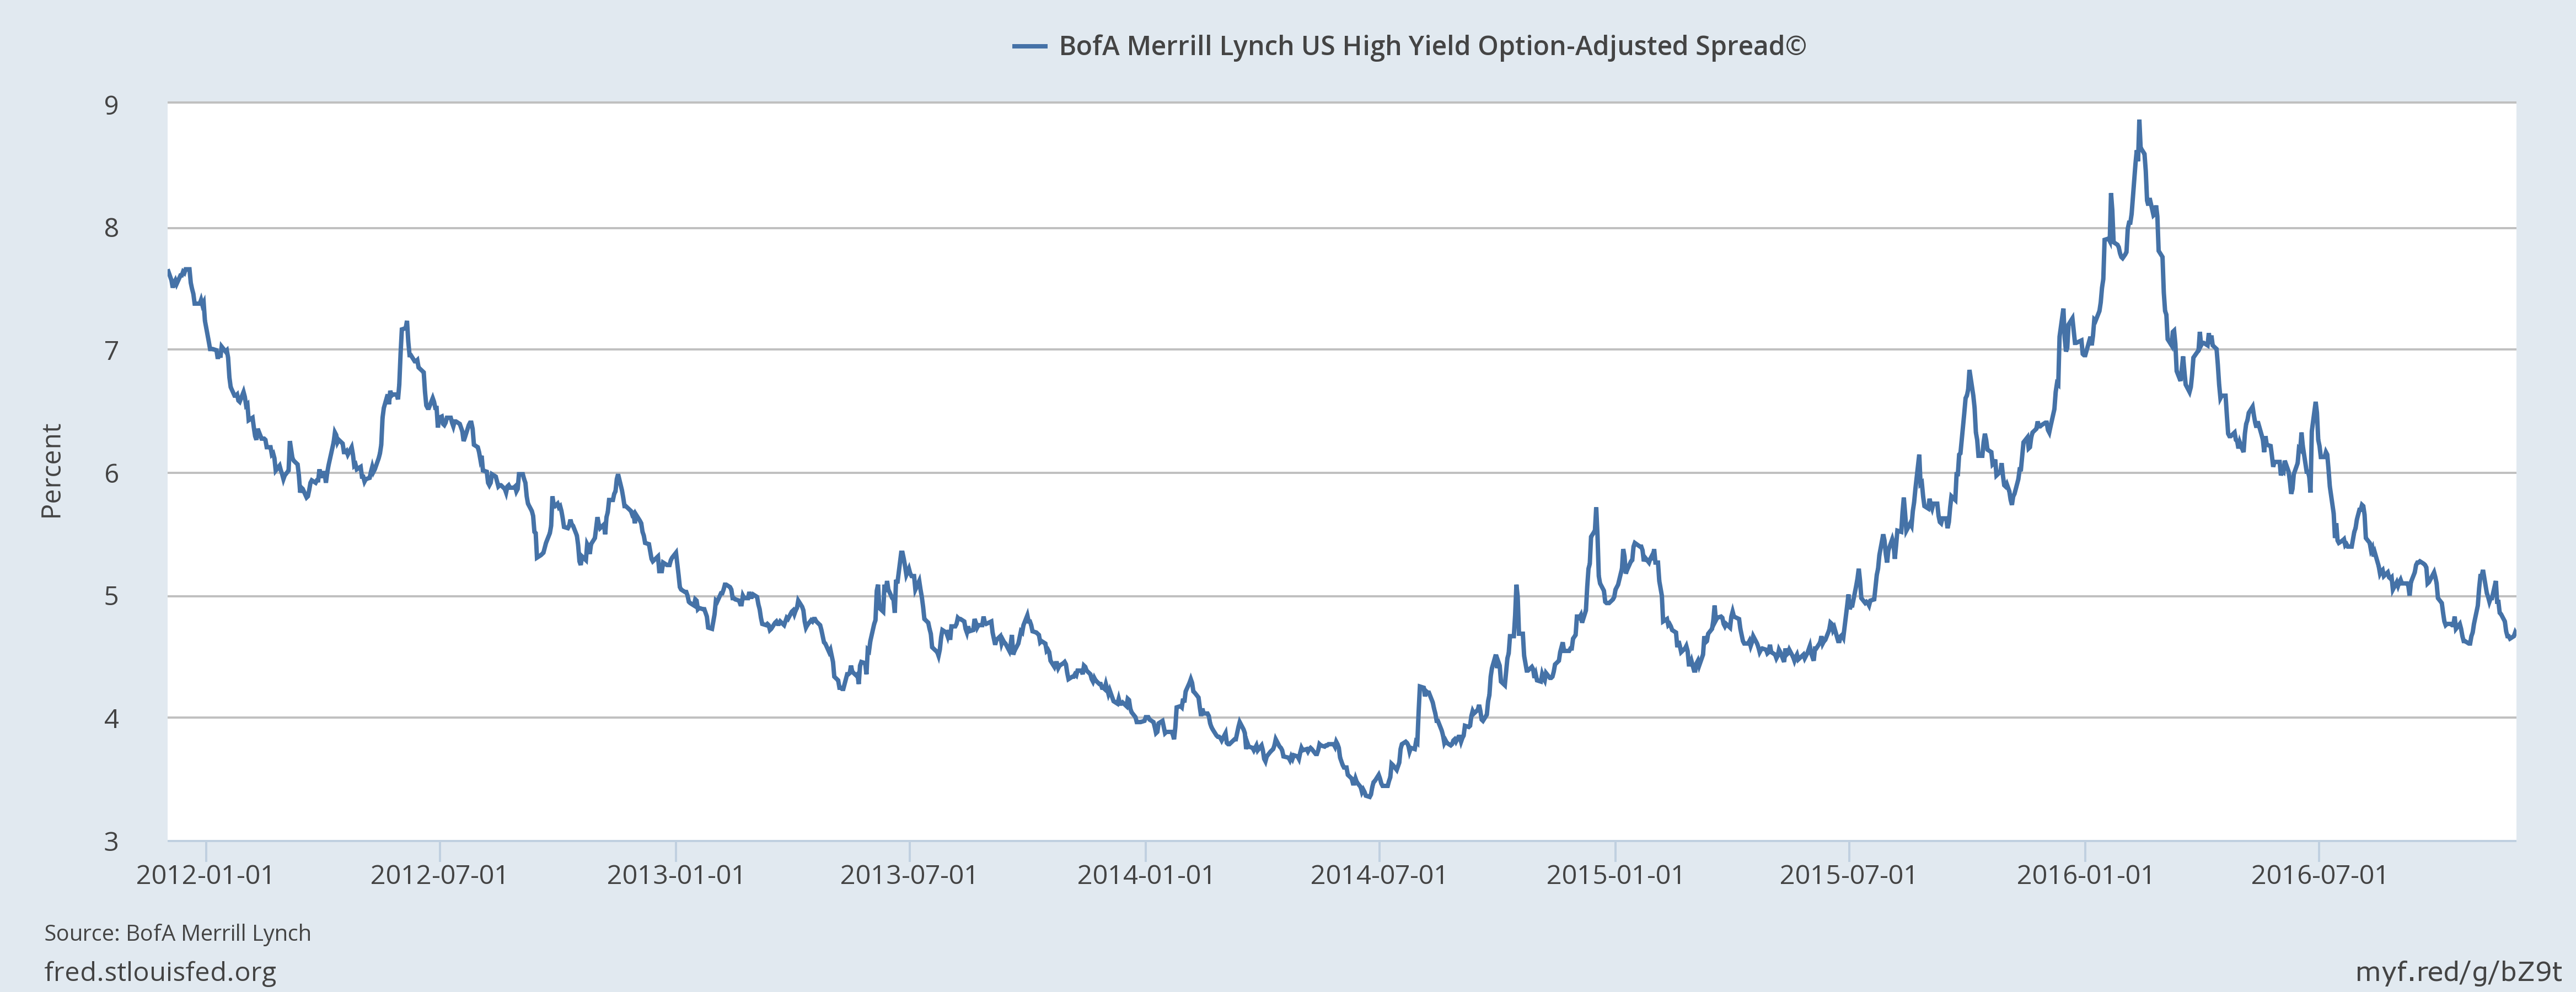
- Credit Spreads : High yield credit spreads narrowed by 24 basis points over the last month, an insignificant move. Spreads are now back to the October lows but still well off the lows of this cycle set back in June of 2014 (3.43%) and the lows of the last cycle (2.41%). It is interesting that spreads have stalled even as oil prices have risen back above $50 since the previous widening was mostly about energy company credits. The default rate hit 7.6% in the second quarter but is back down to about 5.4% more recently with 70% of those in energy. But issuance is way down and junk funds have seen persistent outflows recently. Furthermore, junk bonds tend to have relatively short maturities and there are a lot of bonds that will need refinancing over the next few years. By the way, if you think the junk bond selloff of 2015 was bad – down about 15% from peak to trough – realize that default rates in the last two recessions were in excess of 20%. If the decline is proportional, in the next recession junk bonds will fall 40%. We aren’t in recession obviously – yet – but I wonder if junk bond holders have any clue how much risk they are taking.
(Click on image to enlarge)
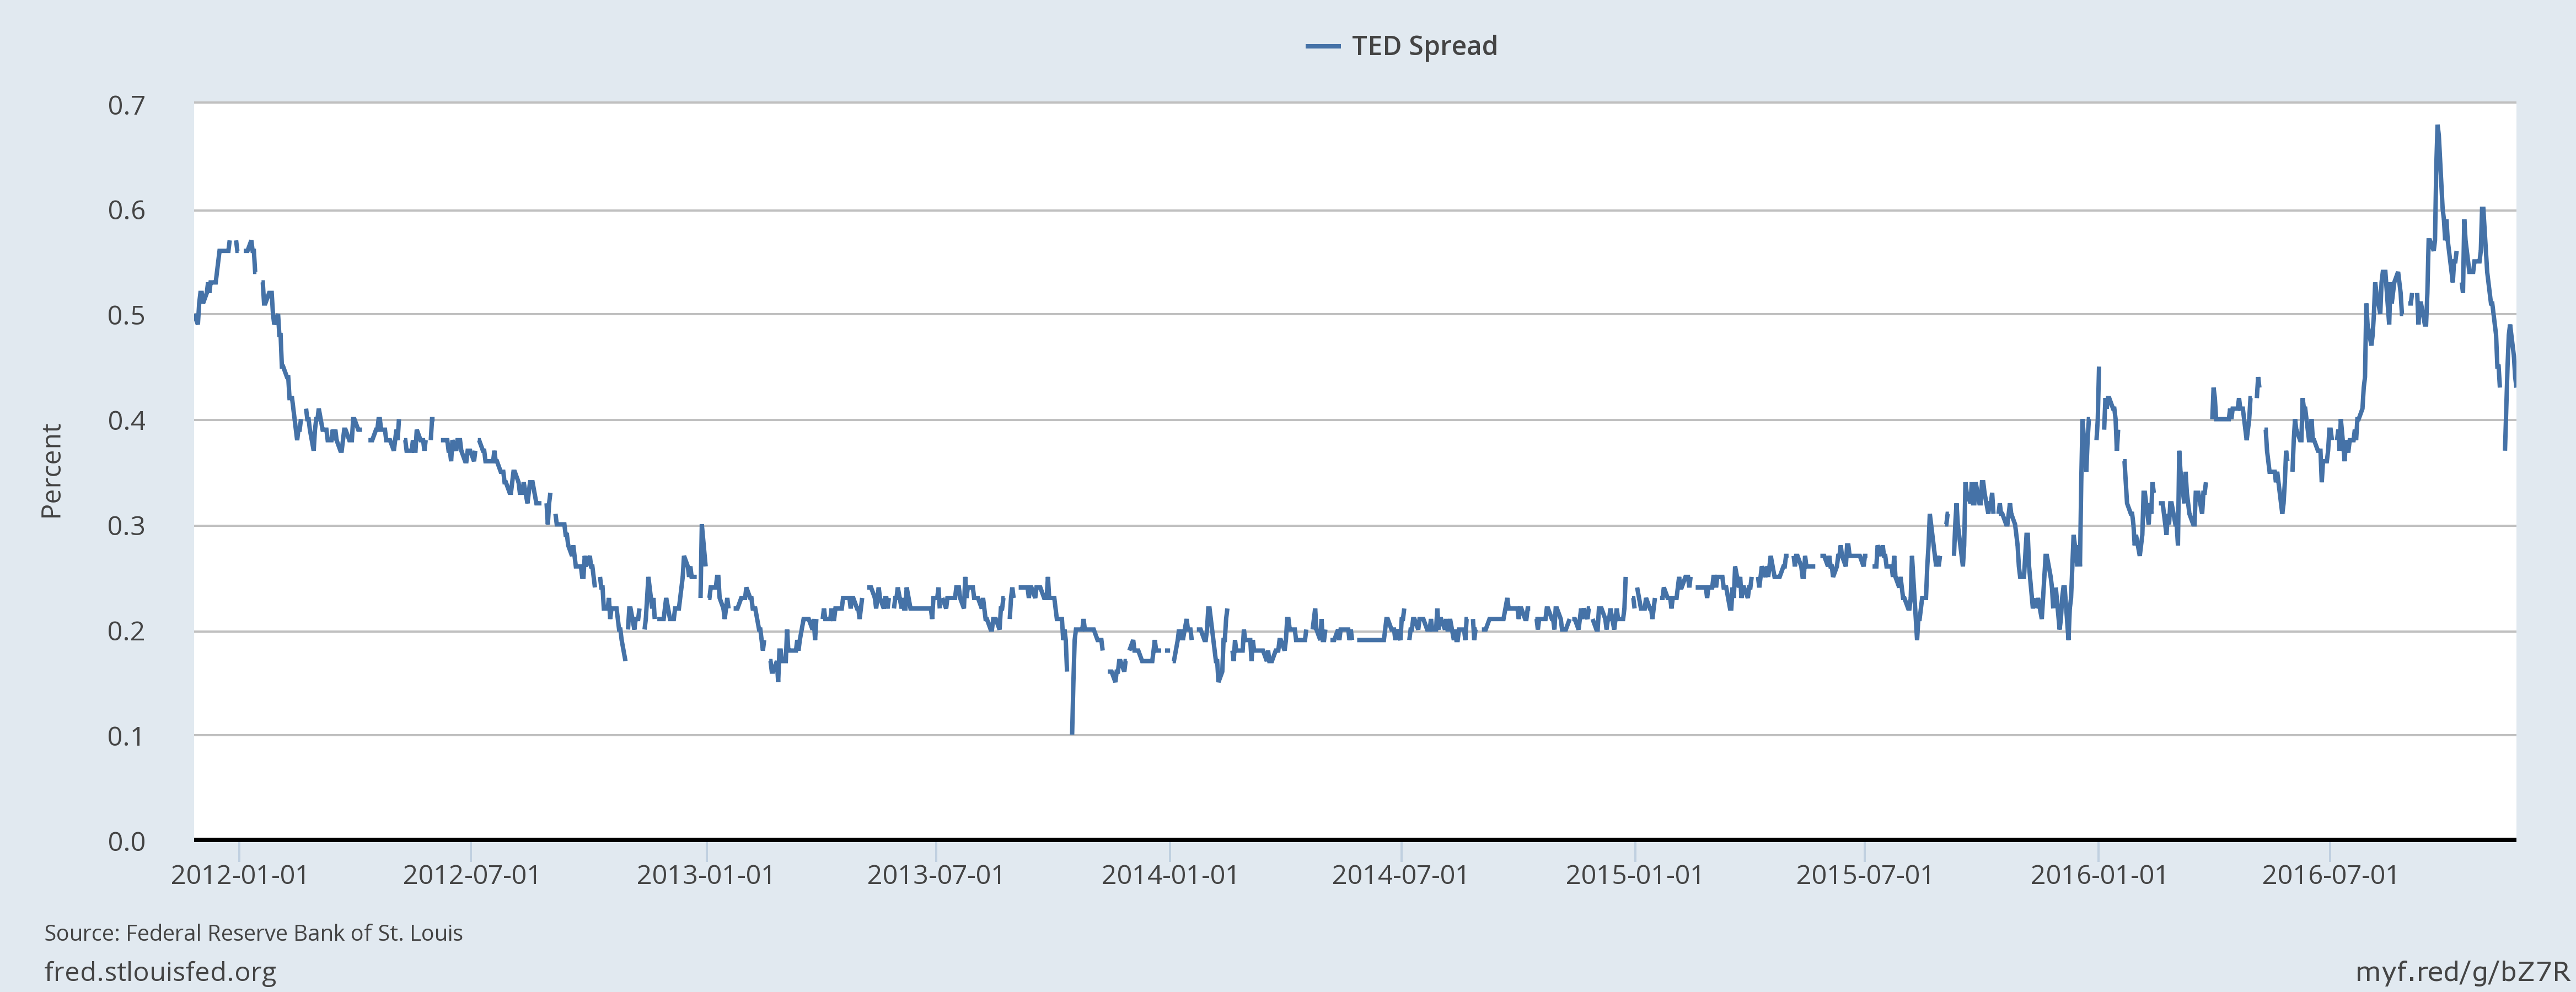
By the way, the TED spread has narrowed a bit recently but only because T-Bill rates rose more than LIBOR. Still it is an improvement.
(Click on image to enlarge)
- Valuations : The good news is that corporate earnings finally turned positive year over year in the last quarter. The bad news is that it was a scant 5.2% (3.2% for the S&P 500 with 98% reporting; Factset) and stock prices have risen so valuation has not improved. Trailing P/E for the S&P 500 based on as reported earnings is about 25 now. Forward P/E based on estimates is about 17 for what that’s worth. Both measures are well above historical means. Shiller P/E is almost 28, a level only exceeded in the dot com era. Market Cap/GDP sits at 123%, a level, once again, only exceeded in the late 90s bubble. Getting back to a mean valuation on any of these measures requires either a big drop in price or a giant leap in growth. Or a long time of stagnating prices while the economy catches up to the stock market. That might happen but it probably isn’t a good idea to bet on it.
Better news can be found in foreign markets. The cheapest markets in the world, based on market cap to GDP measures, are found in Europe and Asia. But it isn’t universal. In Europe, Switzerland and Belgium are expensive while the Netherlands is pretty cheap and Italy is ridiculously cheap. But cheap doesn’t mean ready to go up and while I am maintaining my exposure to these cheap markets, I am quite aware that the US still has the momentum among developed markets. Emerging markets have turned positive versus the S&P 500 from a momentum standpoint but investors there have the uncertainty of Trump trade policy hanging over them now. It is tough to be an international stock investor right now but if value investing was comfortable anyone could do it.
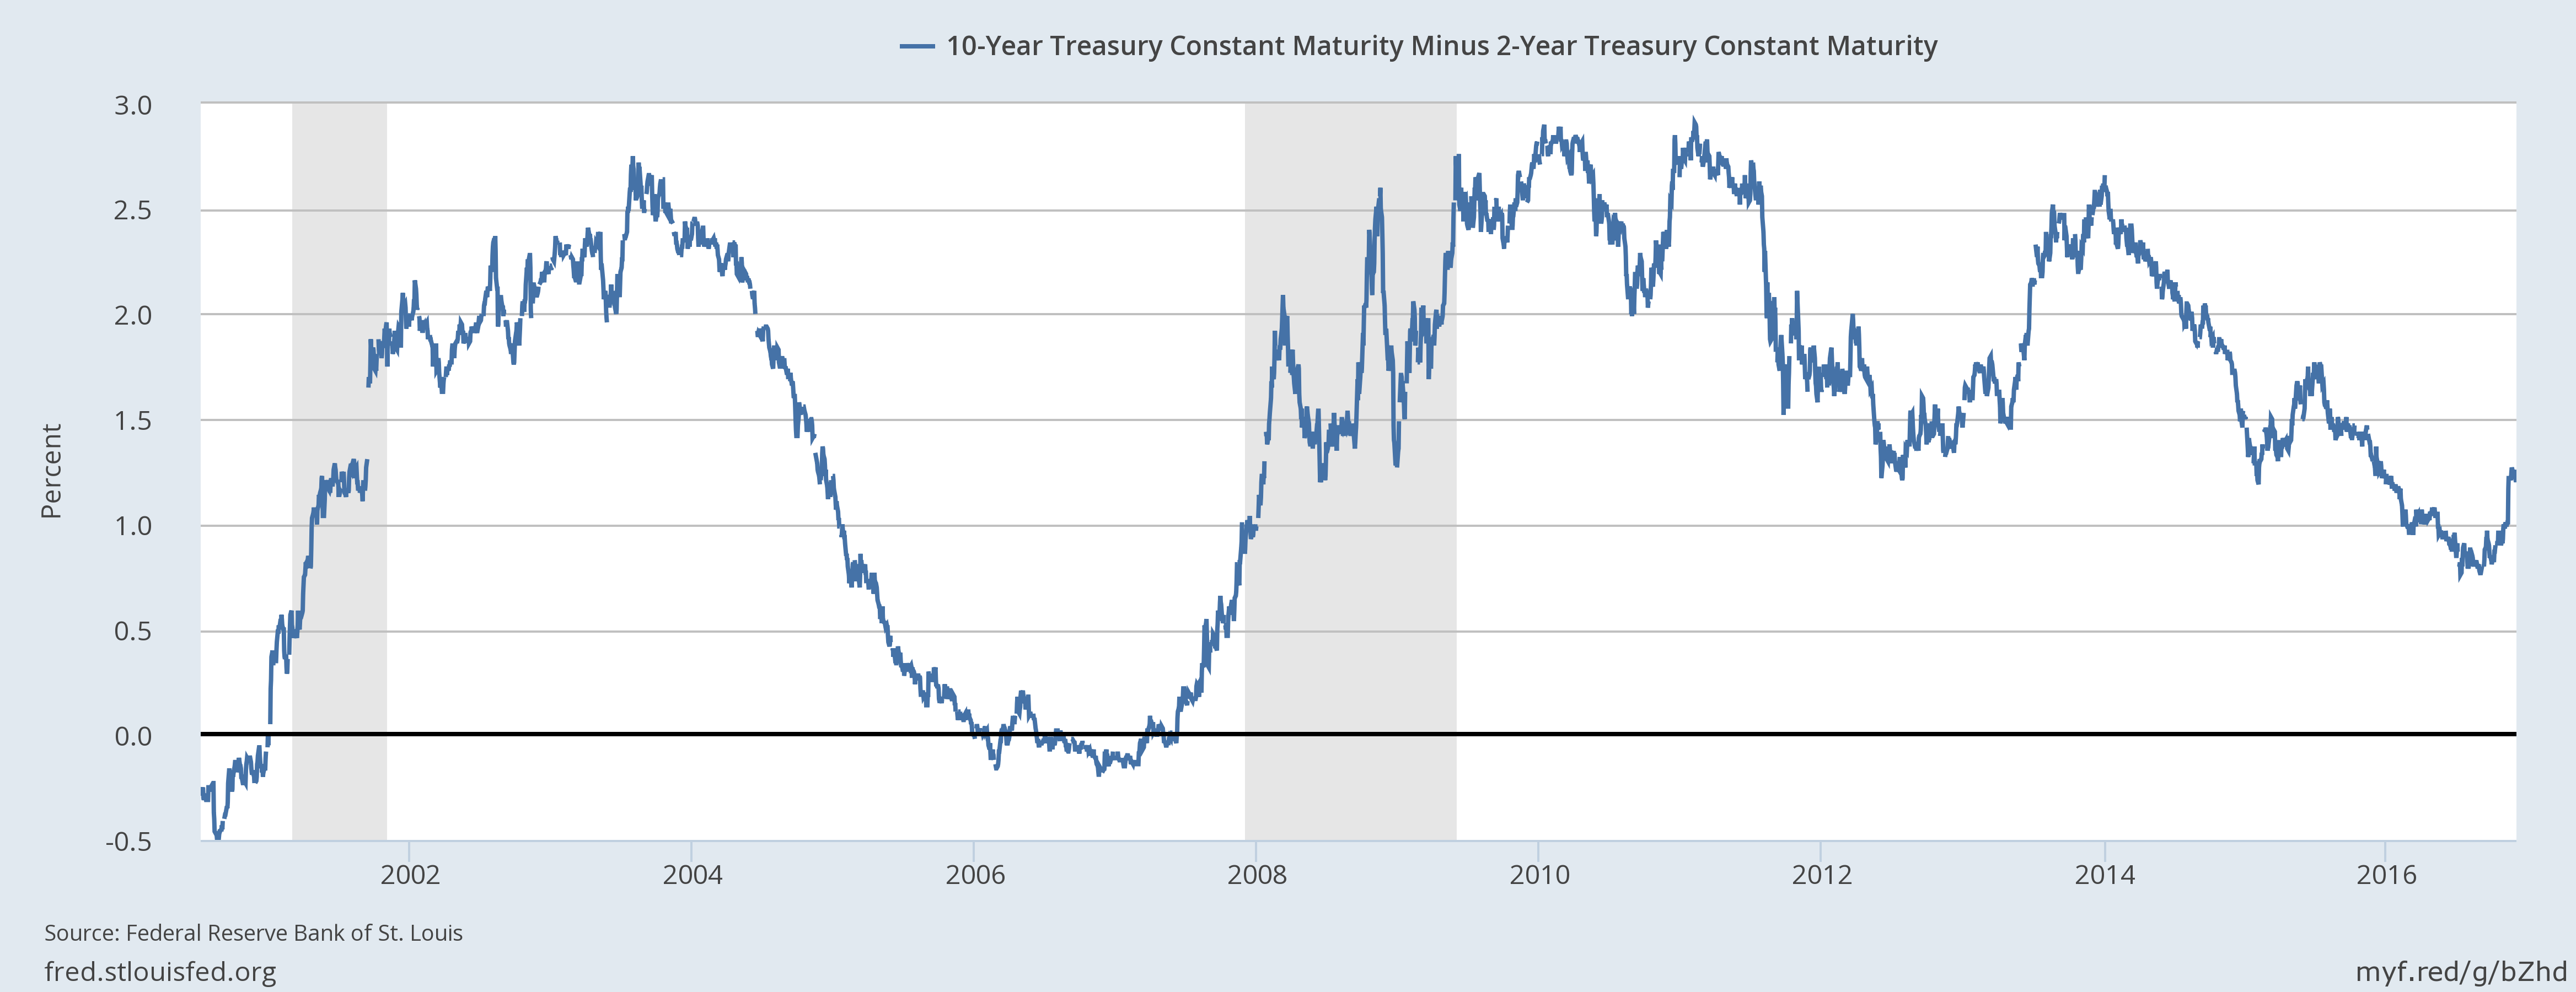
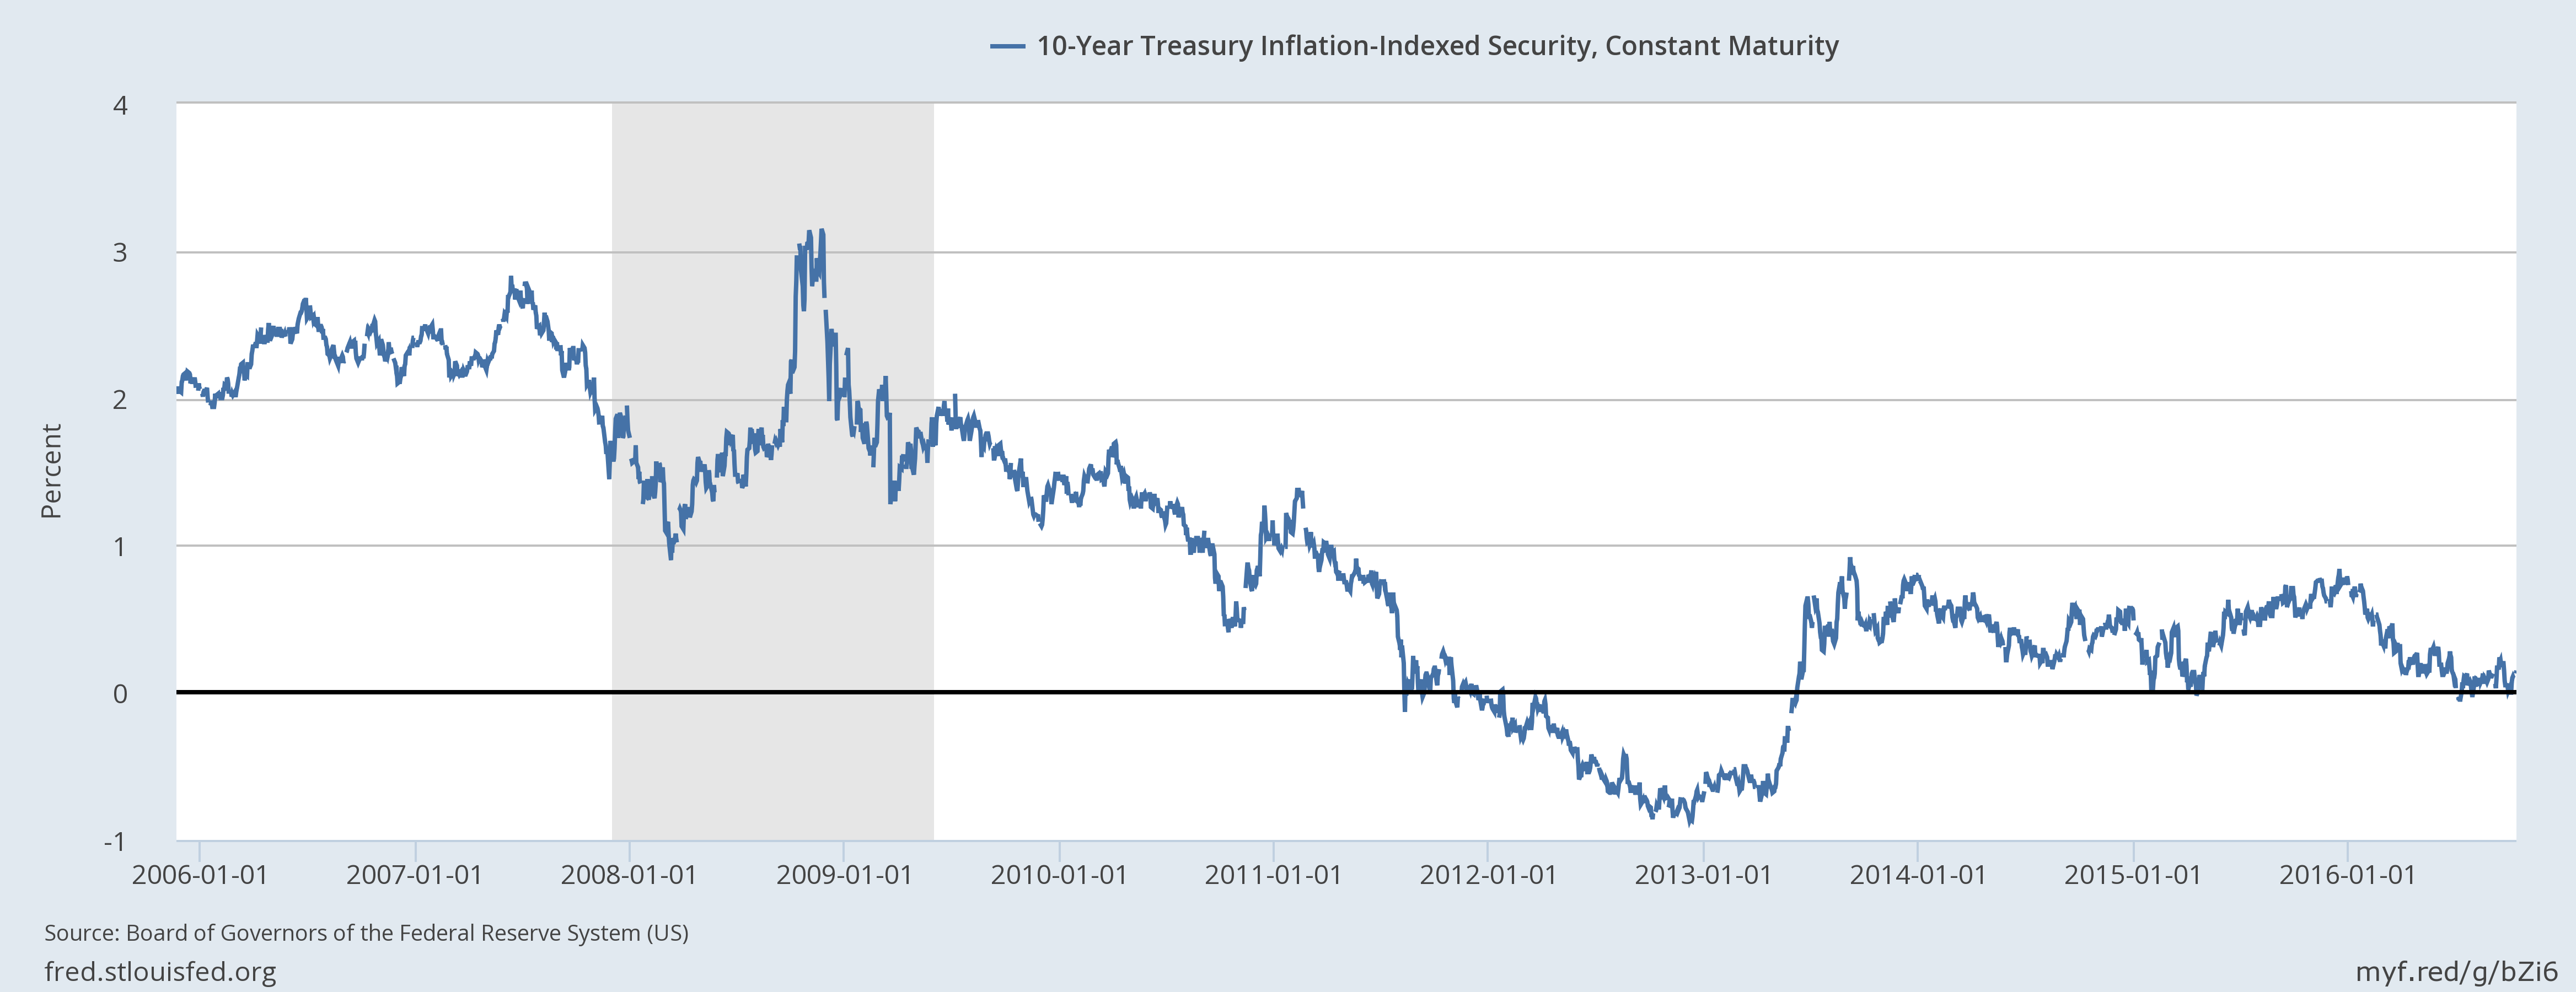
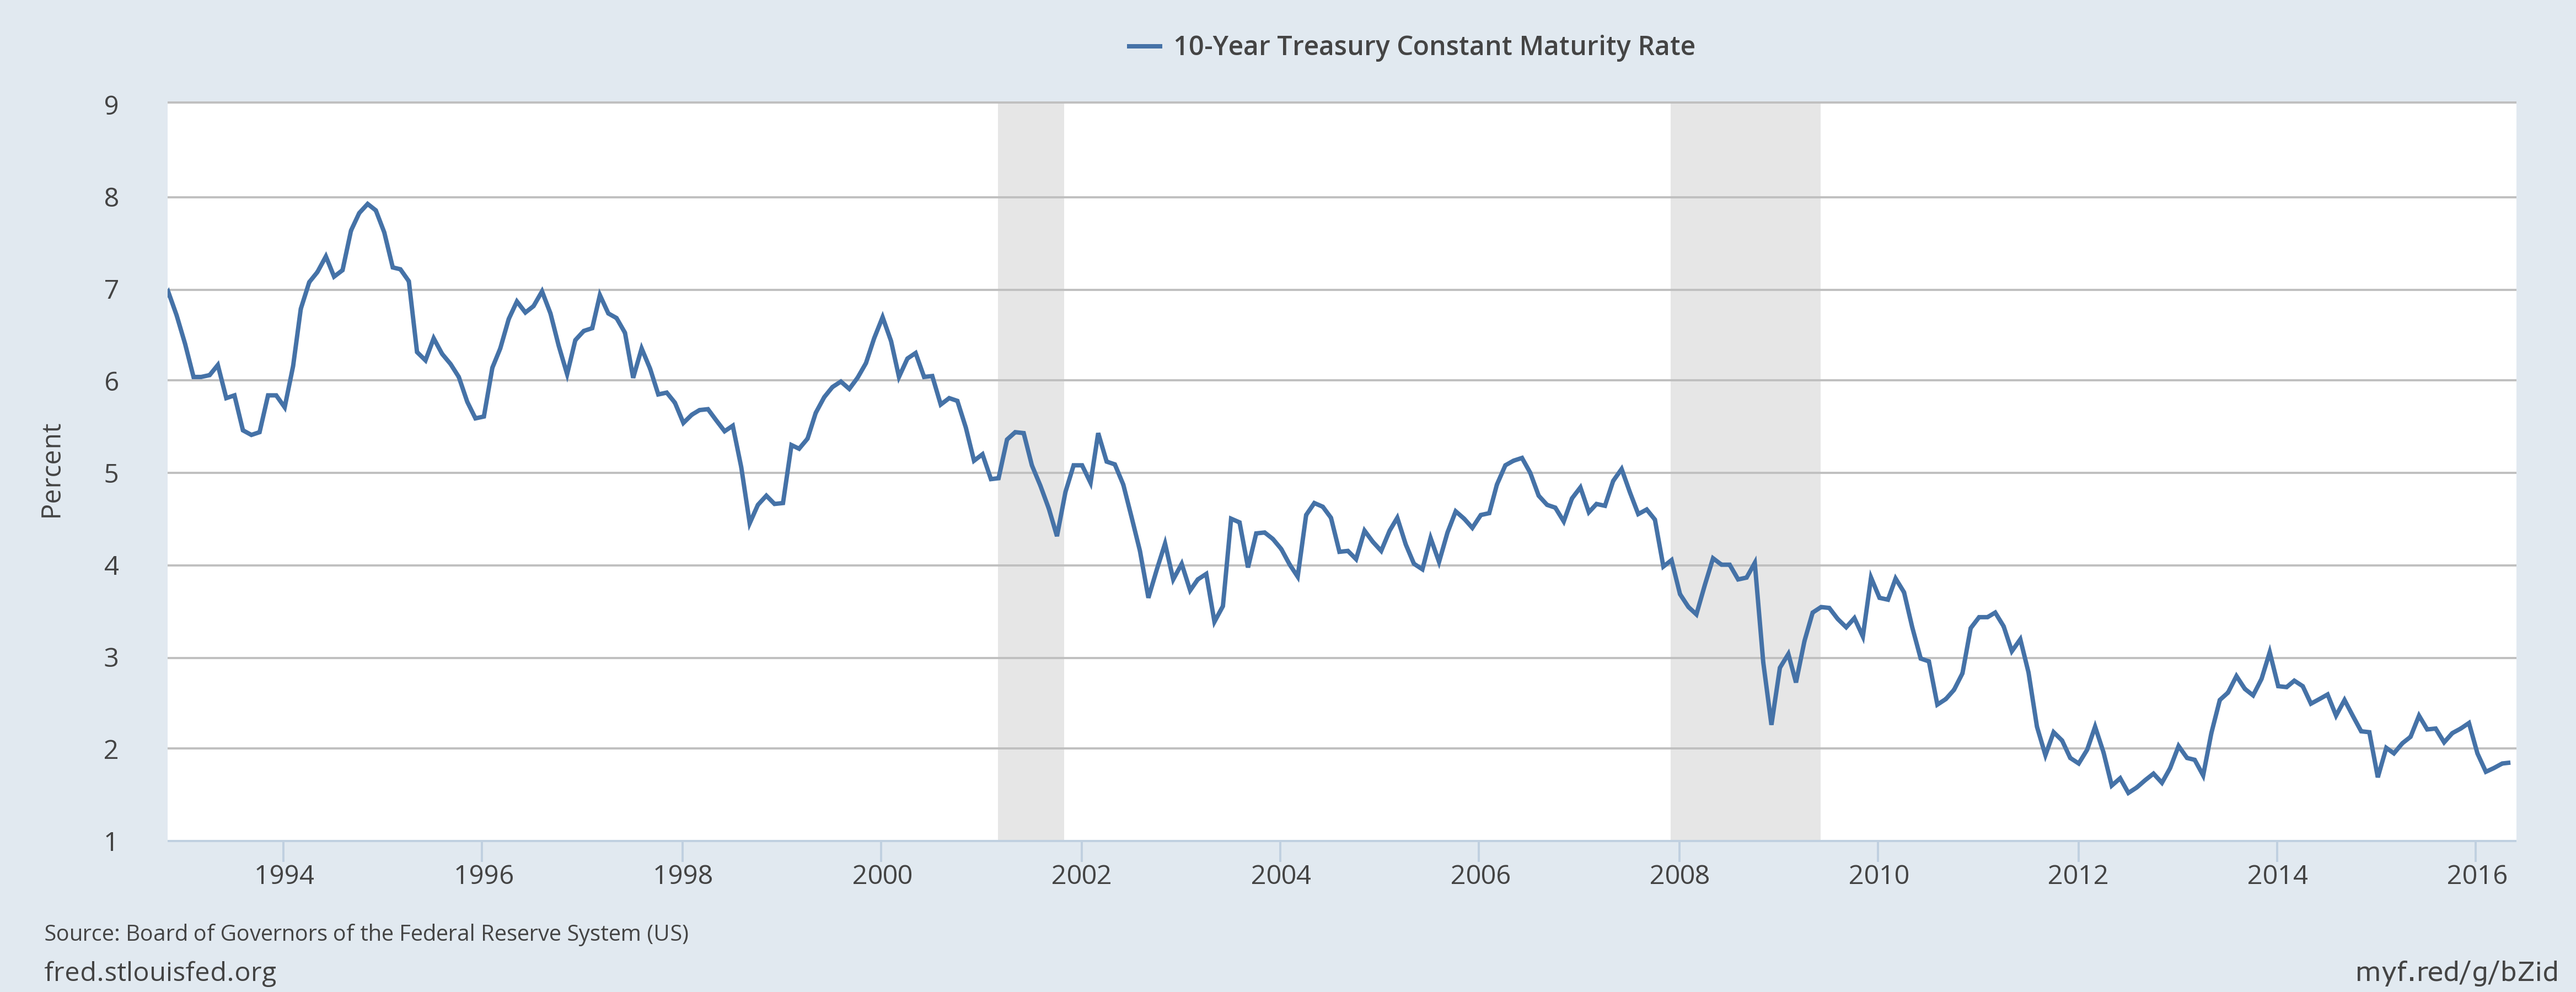
- Yield Curve : The yield curve steepened over the last month. The 10/2 curve moved up by 33 basis points with the 10 year up 61 basis point and the 2 year up 28 basis points. Long rates rising faster than short rates is generally a sign of rising nominal growth expectations rather than Fed action; the December hike is already fully priced into the short end of the curve. The 10 year TIPS rose by 35 basis points, so roughly 57% of the recent rise in rates is based on changing real growth expectations while the other 43% represents a rise in inflation expectations. This is a change from earlier this year when most of the rise in yields was being driven by rising inflation expectations. It is also noteworthy, I think, that 80% of the move up in real rates came after the election. There have been some upbeat economic releases over that time too so some of that may just be an acknowledgment of the growth upturn that was emerging prior to the election. But there is no denying that the market sees Mr. Trump’s potential policies as positive for growth. Not a big positive yet but positive nonetheless.
(Click on image to enlarge)
(Click on image to enlarge)
(Click on image to enlarge)
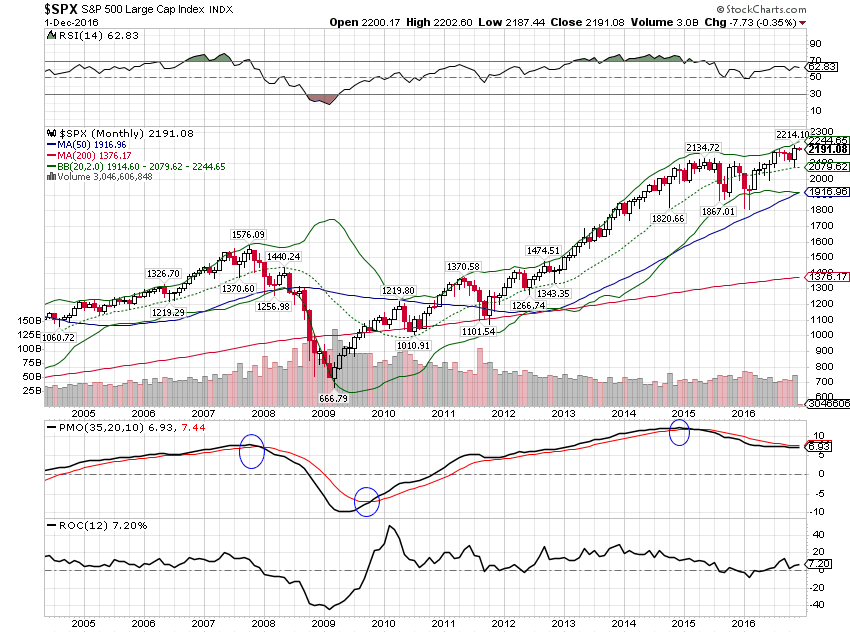
- Momentum : Despite the spike higher after the election, our long term momentum indicator for the S&P 500 remains negative.
(Click on image to enlarge)
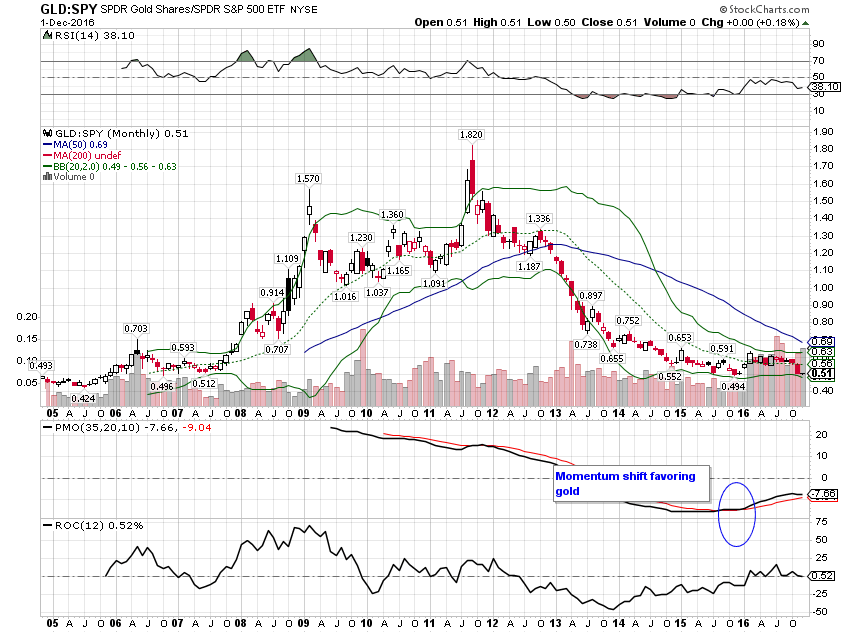
It is actually quite interesting that after what seem like some pretty large moves in several assets, there is little change in the long term momentum picture. Gold is another asset that has had a big move (down 9% over the last month) but long term momentum remained as before, in this case bullish.
(Click on image to enlarge)

The ratio of the two also continues to favor gold on the long term chart:
(Click on image to enlarge)
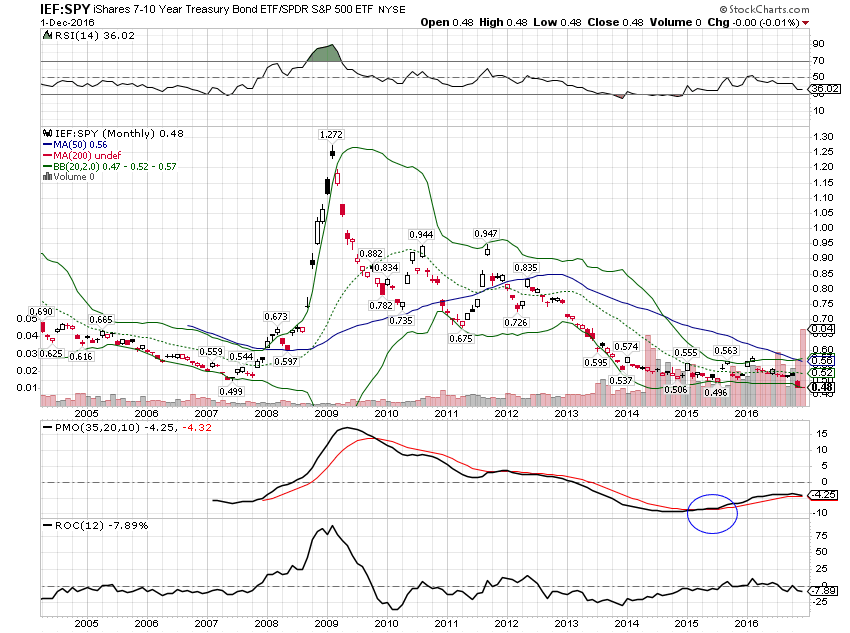
Interestingly, although bonds themselves have broken down, momentum still favors IEF over SPY. It won’t take much more to change that but it hasn’t happened yet:
(Click on image to enlarge)
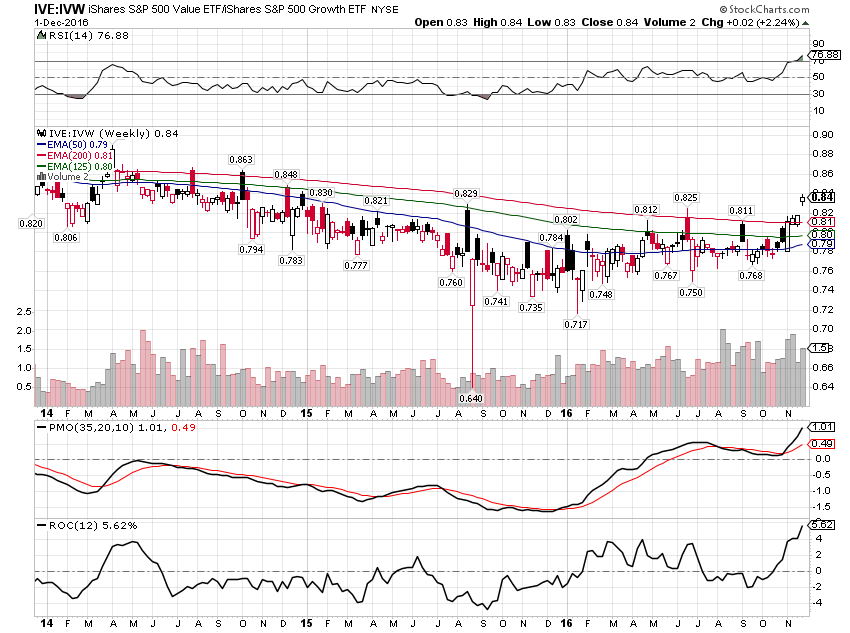
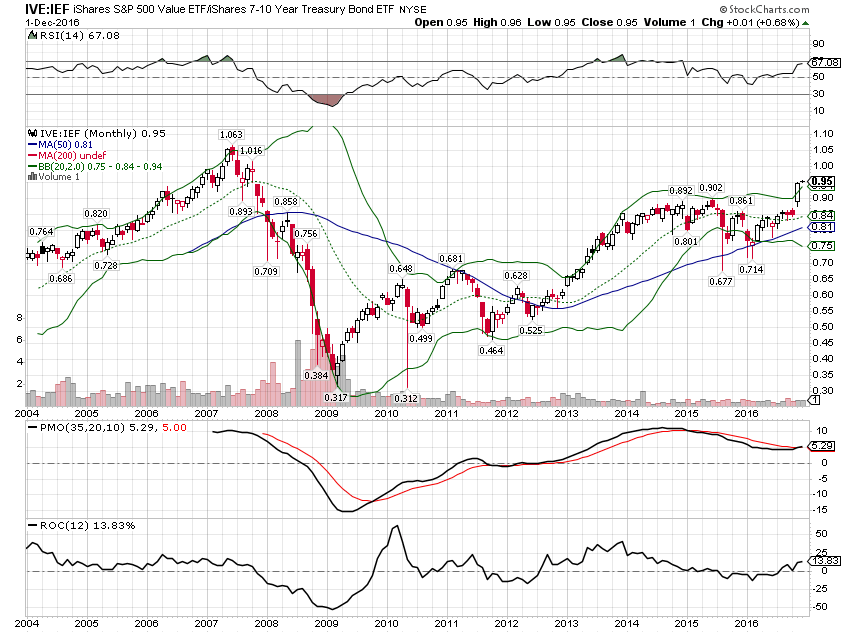
Another interesting tidbit is that S&P 500 value has broken out versus growth and bonds. I will be switching part of our SPY exposure this month to IVE:
(Click on image to enlarge)
(Click on image to enlarge)
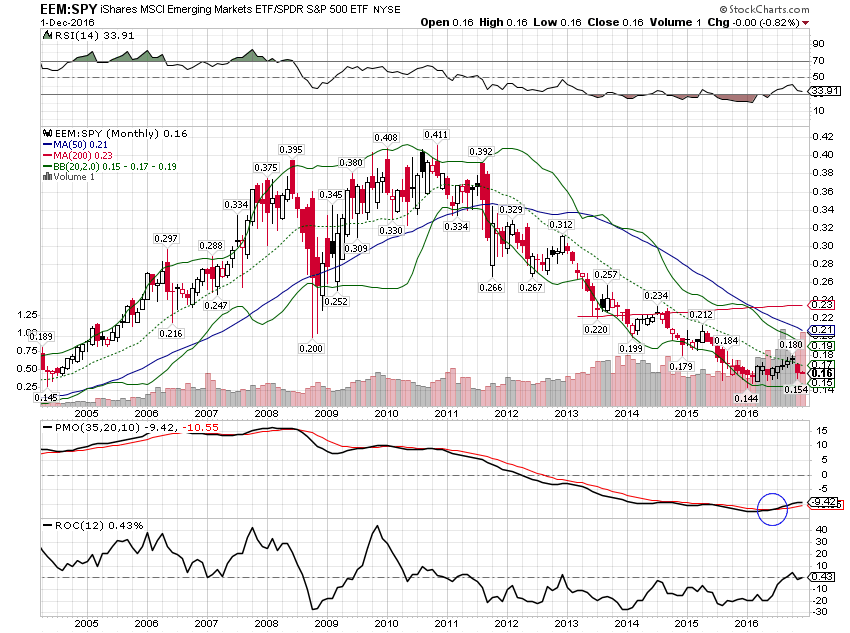
Yes, short term and intermediate term momentum has definitely downshifted for EEM versus SPY but the long term momentum buy signal is still in place. Given Trump’s rhetoric on trade it may be just a matter of time before this breaks down but for now I’m holding what’s now cheaper.
(Click on image to enlarge)
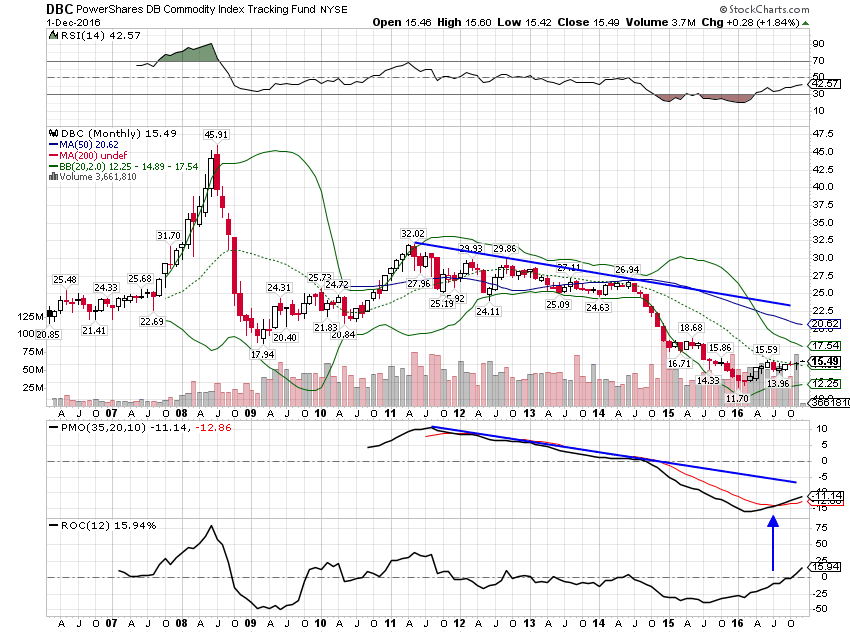
Commodities maintained their momentum on an absolute basis as well as in relation to stocks:
(Click on image to enlarge)
(Click on image to enlarge)
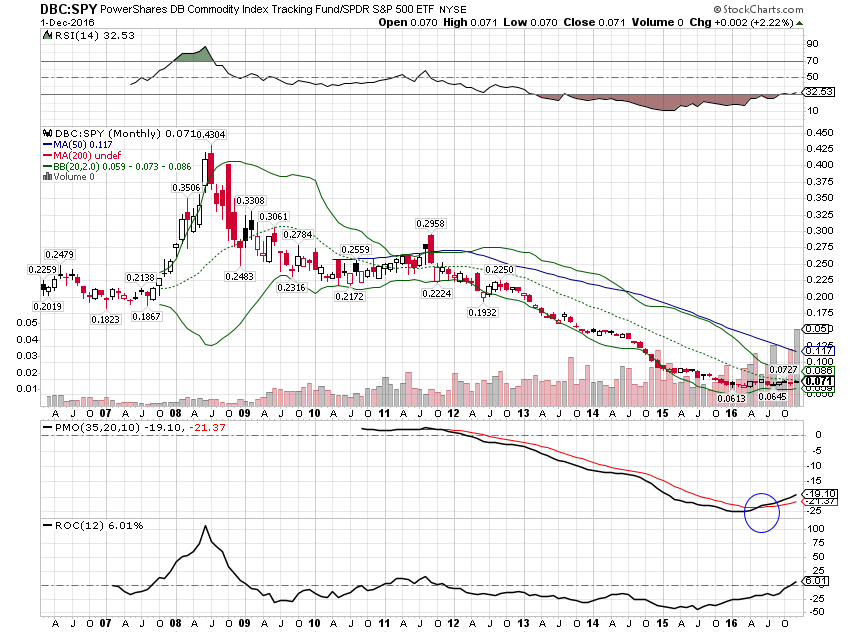
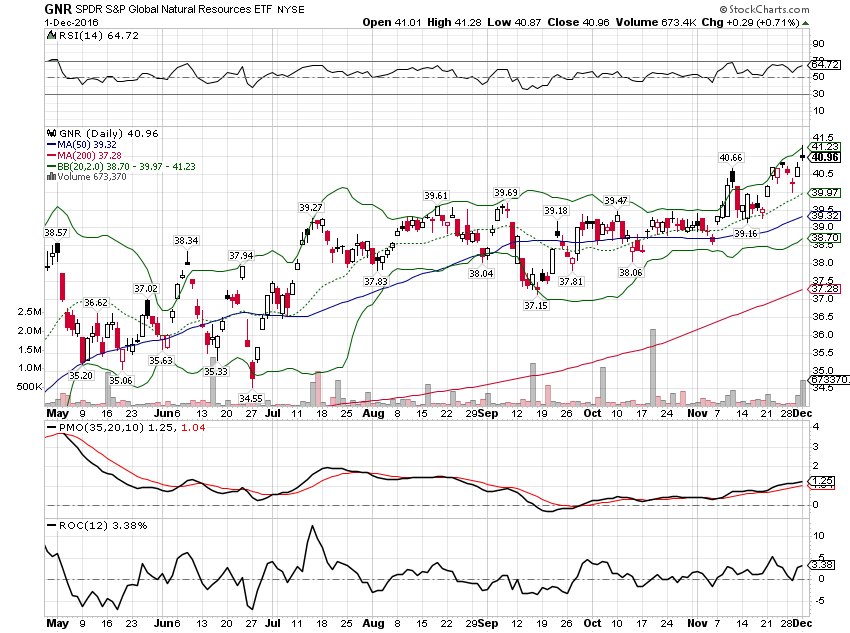
That translates to natural resource stocks as well and I’m adding them this month, using part of our previous cash position:
(Click on image to enlarge)
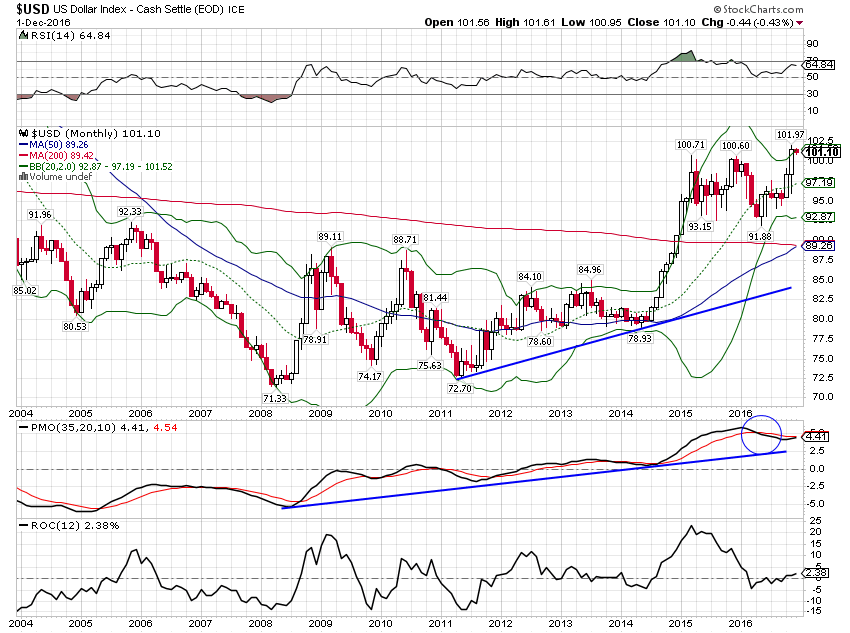
The dollar index has made a new high but like so many others we’ve looked at, the long term momentum has yet to change:
(Click on image to enlarge)
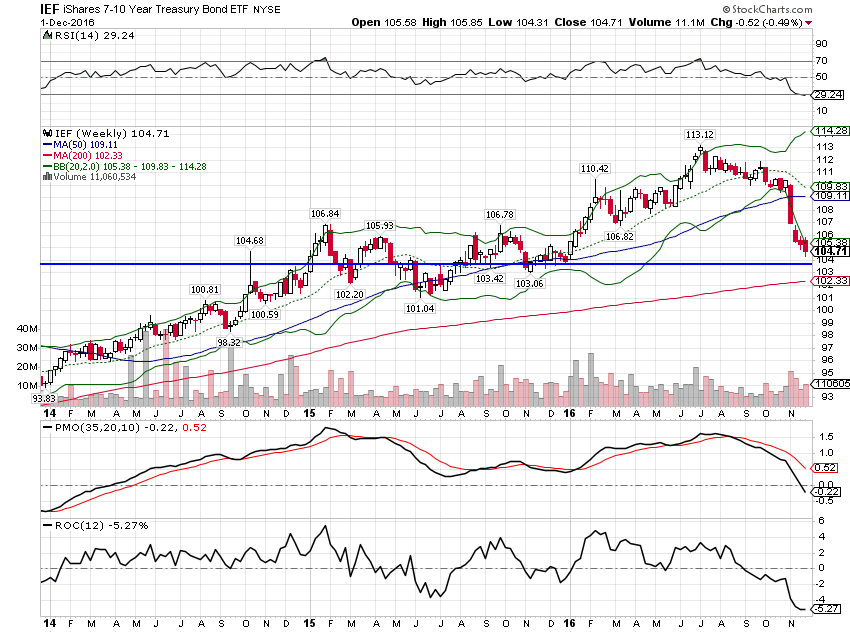
As I said above, bonds have broken down on a short term and intermediate term basis. But IEF has fallen to an area of support and is I believe ready for at least a bounce. Given my beliefs about how hard it will be to change our growth profile, it may turn out to be more but for now I’m treating it as a short term position. I’m going to extend the duration of our bond portfolio slightly to take advantage of the oversold condition.
(Click on image to enlarge)
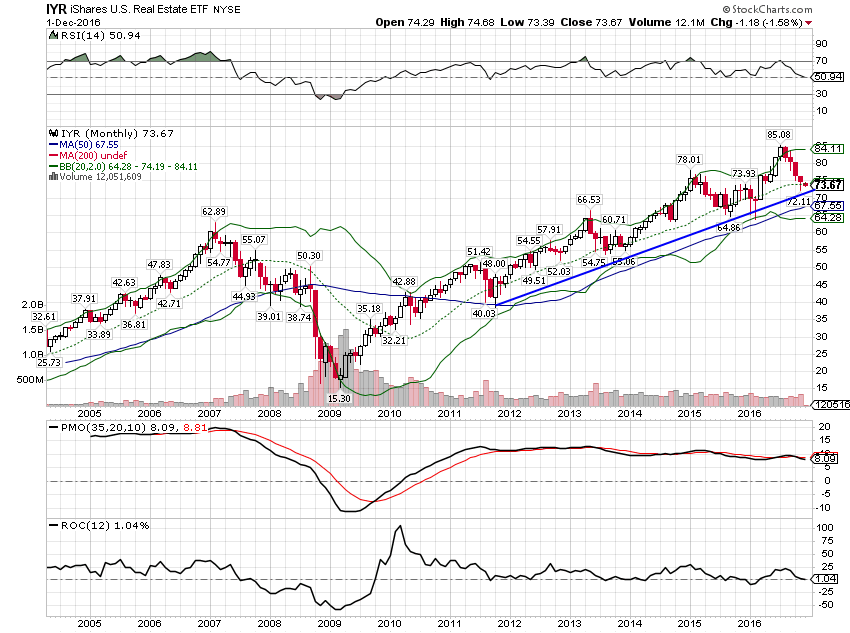
Last but not least, REITS have fallen to the long term uptrend line
(Click on image to enlarge)
Portfolio Changes
- Reduce SPY and initiate position in IVE (S&P 500 Value)
- Increase IYR to buy near long term uptrend line
- Reduce SHY and add to IEF – increase portfolio duration slightly
- Add GNR to the portfolio as a commodity substitute
The Moderate Portfolio asset allocation now looks like this:
(Click on image to enlarge)
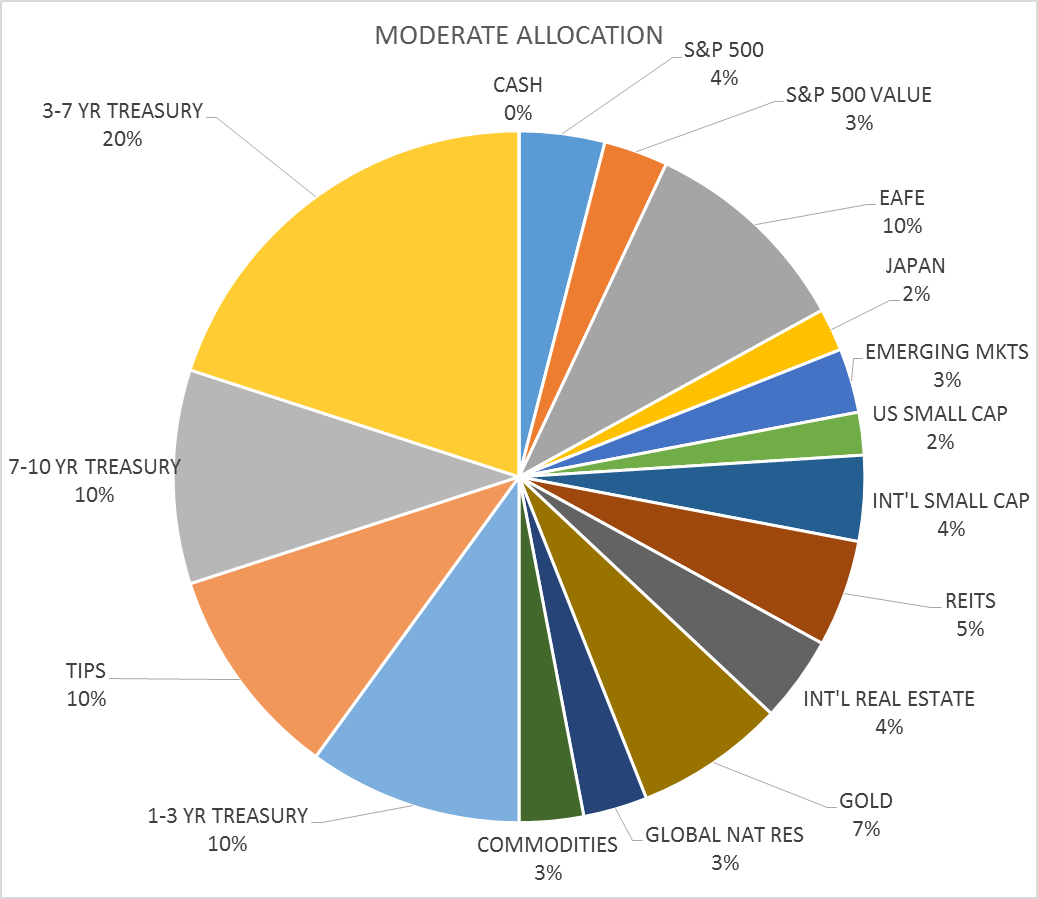
Growth expectations have risen some in the US based on movements in the bond market. It isn’t a big change but it is for the better and must be acknowledged in the allocation. I am still somewhat skeptical about the policy mix being offered, especially when it comes to trade, but when the market moves so must I.
Disclosure: This material has been distributed for ...
more


