
Here’s the picture: revisions up in Q3 GDP, and GDP+. Note that GDP+ indicates no downturn in 2022H1.
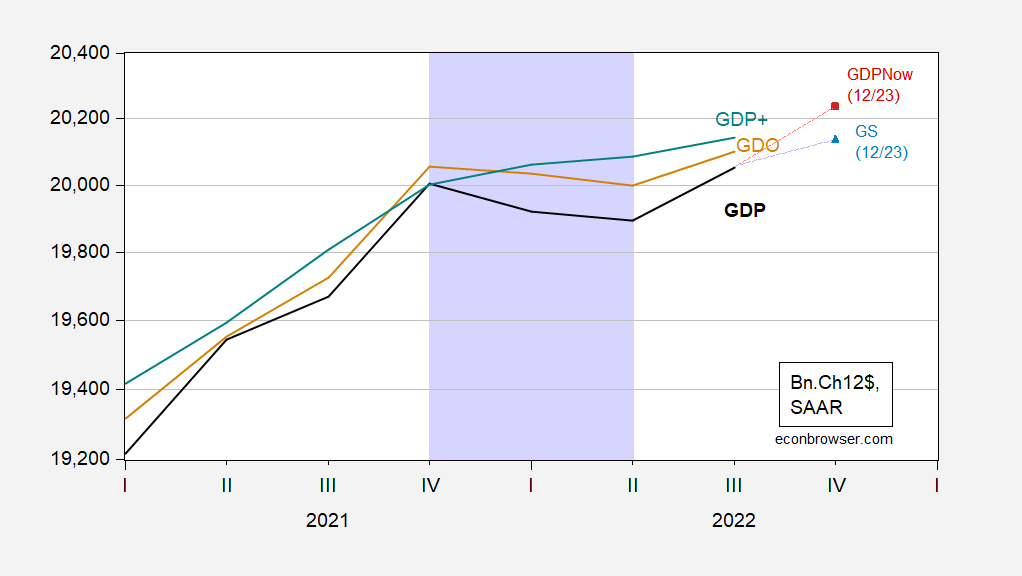
Figure 1: GDP (bold black), GDO (tan), GDP+ (green), GDPNow for Q4 (red square), Goldman Sachs (12/23) (teal triangle), all in blillions Ch.2012$, SAAR. GDP+ level calculated by iterating on 2019Q4 GDP (when GDP and GDO matched). Lilac shading denotes peak-to-trough for a hypothesized 2022H1 recession. Source: BEA (Q4 3rd release), Federal Reserve Bank of Philadelphia (12/22), Federal Reserve Bank of Atlanta (12/23), Goldman Sachs (12/23), and author’s calculations.
More By This Author:
Weekly Macro Indicators Thru December 17Yet More On Adjusting The CES, Private Nonfarm Payroll
More On Adjusting The CES


Comments
Log in or sign up to join the conversation.