
With GDI reported, we no longer have to guess in order to calculate GDO. GDP+ is also reported out. We have the following picture through Q4.
(Click on image to enlarge)
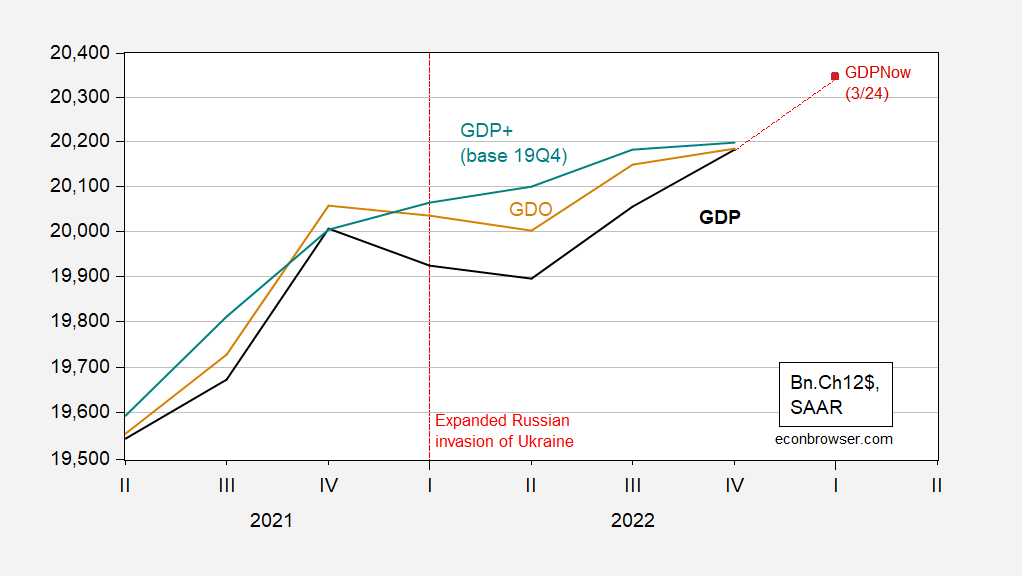
Figure 1: GDP (black), GDPNow of 3/24 (red square), GDO (tan), GDP+ (green), all in billions Ch.2012$ SAAR. GDP+ level calculated by iterating growth rates on 2019Q4 actual GDP. Source: BEA, 2022Q4 3rd release, Atlanta Fed, Philadelphia Fed, and author’s calculations.
It’s interesting to contrast these results with what we thought two months ago; then GDO (setting the net operating component at 2022Q3 levels) was under GDP. On the other hand, GDP+ is below what was originally estimated, and growth in GDP+ is definitely decelerating.
Nonetheless, it is interesting that GDP+ is continuously rising throughout 2022H1, suggesting no deceleration in activity that would be consistent with a recession.
More By This Author:
Deposits On The MoveStress
Weekly Macro Indicators, Thru March 18


Comments
Log in or sign up to join the conversation.