

Image Source: Pexels
Revised up 0.2 ppts, 0.2 ppts above consensus. Final sales up 0.2 ppts. GDO rises 2.1% q/q SAAR.
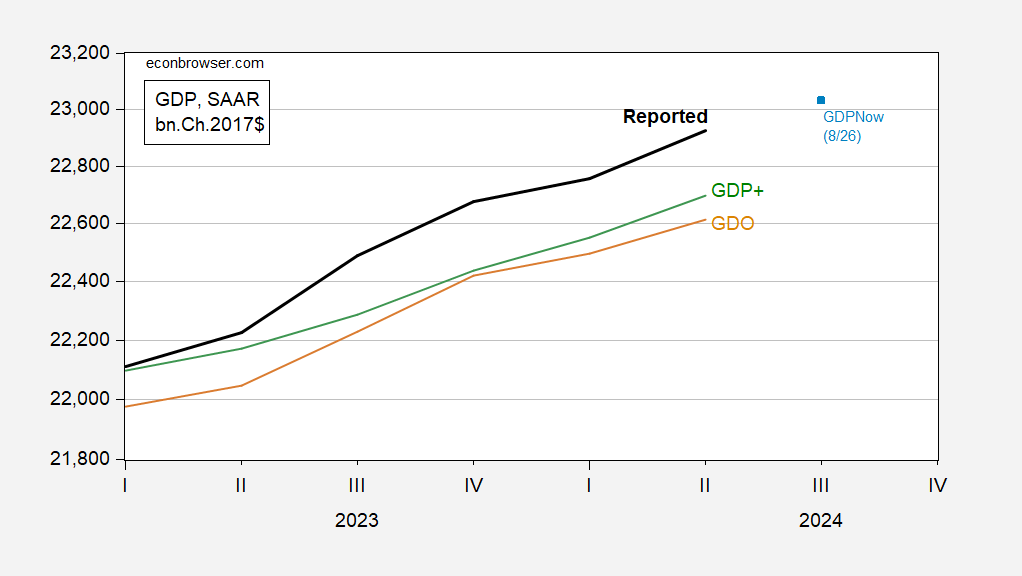
Figure 1: GDP (bold black), GDO (tan), and GDP+ (green), GDPNow of 8/26 (sky blue square), all in bn.Ch.2017$ SAAR. GDP, GDO based on 2nd release. GDP+ iterated on 2019Q4 GDP level. Source: BEA, Philadelphia Fed (July release), Atlanta Fed, author’s calculations.
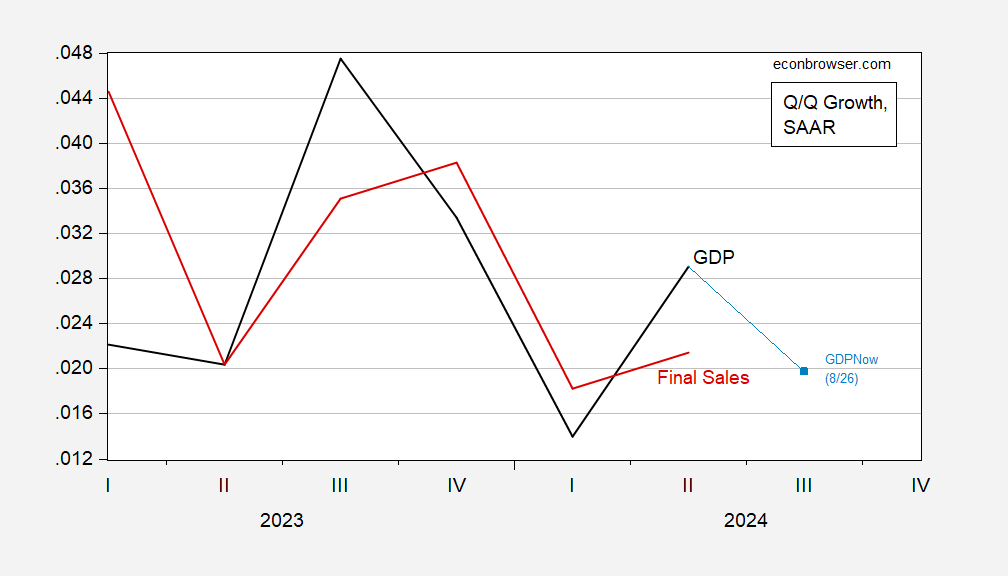
Figure 2: Quarter-on-Quarter growth of GDP (bold black), GDPNow of 8/26 (sky blue square), final sales (red), all SAAR. GDP based on second release. Source: BEA, Atlanta Fed, author’s calculations.
So, GDP and final sales growth exceeds trend in Q2, and GDPNow as of 3 days ago is at trend. GDP > final sales implies some retrenchment in Q3 given inventory accumulation.
More By This Author:
EJ Antoni On The Current RecessionEconomic Sentiment And Confidence In August
Spreads In The Meatpacking Industry: Beef


Comments
Log in or sign up to join the conversation.