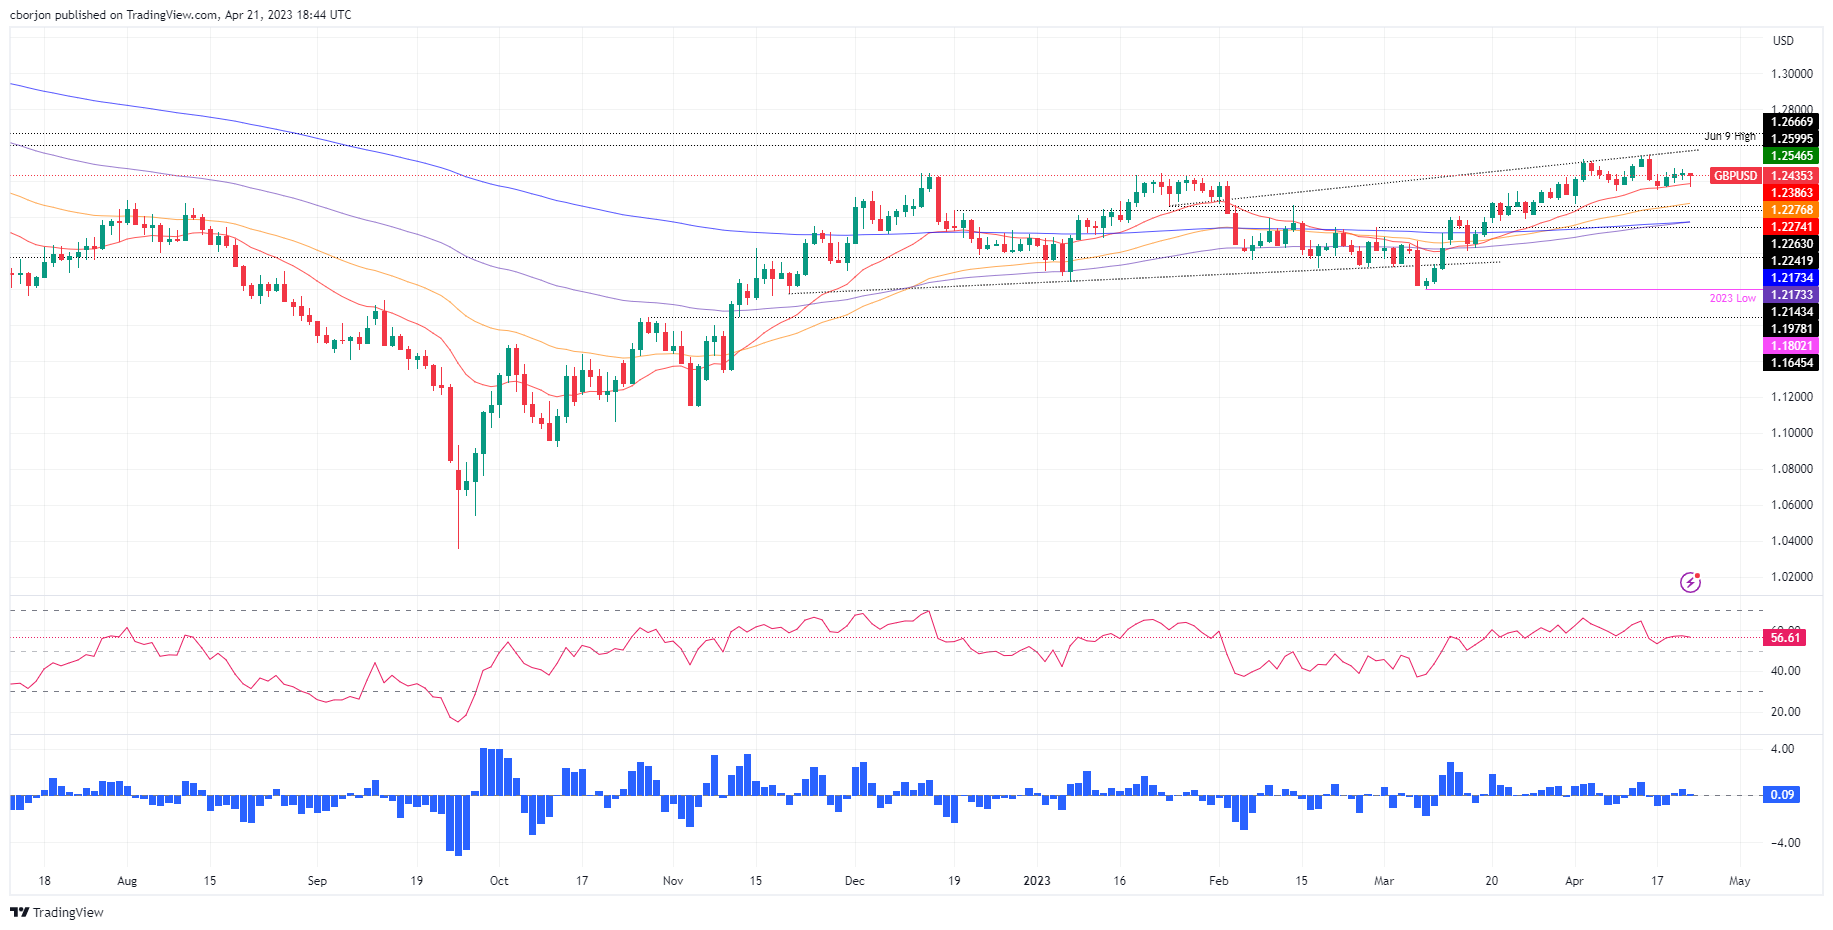
GBP/USD Price Analysis: Doji Candlesticks Around 1.2430 Flashes Bulls/Bears Indecision
After a tranche of UK and US economic data, GBP/USD stays in sideways choppy trading, keeping the pair scrambling for direction following the last three days of uncertainty. From a technical perspective, three doji’s in a row suggests neither buyers’ nor sellers’ commitment to open fresh positions. Hence, GBP/USD is trading at 1.2439 after printing a low at 1.2367, below the 20-day Exponential Moving Average (EMA).
GBP/USD Price Action
Friday’s session was titled downwards, but since the early North American session, the GBP/USD aimed up, about to erase its earlier losses. Although the GBP/USD warrants further upside, price action in the last few days suggests buyers might be losing momentum. Indicators, like the Relative Strength Index (RSI), turned flat though tilted downwards, heading into neutral territory. At the same time, the Rate of Change (RoC) edged lower when compared to Thursday’s price action, suggesting that buying pressure is fading.
Therefore, the GBP/USD path of least resistance is downwards. The GBP/USD needs to crack the 1.2400 figure for a bearish resumption. Once cleared, the pair could dive towards the 20-day EMA at 1.2386, followed by the confluence of the April 3 low and the 50-day EMA at 1.2274/76. A breach of the latter and the GBP/USD could plunge toward the confluence of the 100 and 200-day Emas, around 1.2173.
On the flip side, if GBP/USD stays above 1.2400, it could test the April 19 cycle high at 1.2474. Buyers reclaiming the latter, upside risks will clear at 1.2500, followed by the YTD high at 1.2546.
GBP/USD Daily Chart
(Click on image to enlarge)
GBP/USD
| OVERVIEW | |
|---|---|
| Today last price | 1.2437 |
| Today Daily Change | -0.0006 |
| Today Daily Change % | -0.05 |
| Today daily open | 1.2443 |
| TRENDS | |
|---|---|
| Daily SMA20 | 1.2402 |
| Daily SMA50 | 1.2202 |
| Daily SMA100 | 1.2196 |
| Daily SMA200 | 1.1924 |
| LEVELS | |
|---|---|
| Previous Daily High | 1.2468 |
| Previous Daily Low | 1.2405 |
| Previous Weekly High | 1.2546 |
| Previous Weekly Low | 1.2344 |
| Previous Monthly High | 1.2424 |
| Previous Monthly Low | 1.1803 |
| Daily Fibonacci 38.2% | 1.2444 |
| Daily Fibonacci 61.8% | 1.2429 |
| Daily Pivot Point S1 | 1.2409 |
| Daily Pivot Point S2 | 1.2375 |
| Daily Pivot Point S3 | 1.2346 |
| Daily Pivot Point R1 | 1.2473 |
| Daily Pivot Point R2 | 1.2502 |
| Daily Pivot Point R3 | 1.2536 |
More By This Author:
WTI Price Analysis: Bears In Control, On Verge To Close The Gap
Johnson & Johnson Earnings: JNJ Breaks Above Resistance Following Q1 Beat, Targets $180
USD/JPY Price Analysis: Gaining Momentum On Rising US Treasury Bond Yields
Disclaimer: Information on these pages contains forward-looking statements that involve risks and uncertainties. Markets and instruments profiled on this page are for informational purposes only ...
more


