

The price of oil is under pressure on Thursday, extending the losses from mid-week trade, and on the verge of closing the gap as the following will illustrate.
As per the prior analysis, WTI bears move in and eye a close of the gap at $75.65, the price of oil is closing the gap:
WTI prior analysis
(Click on image to enlarge)
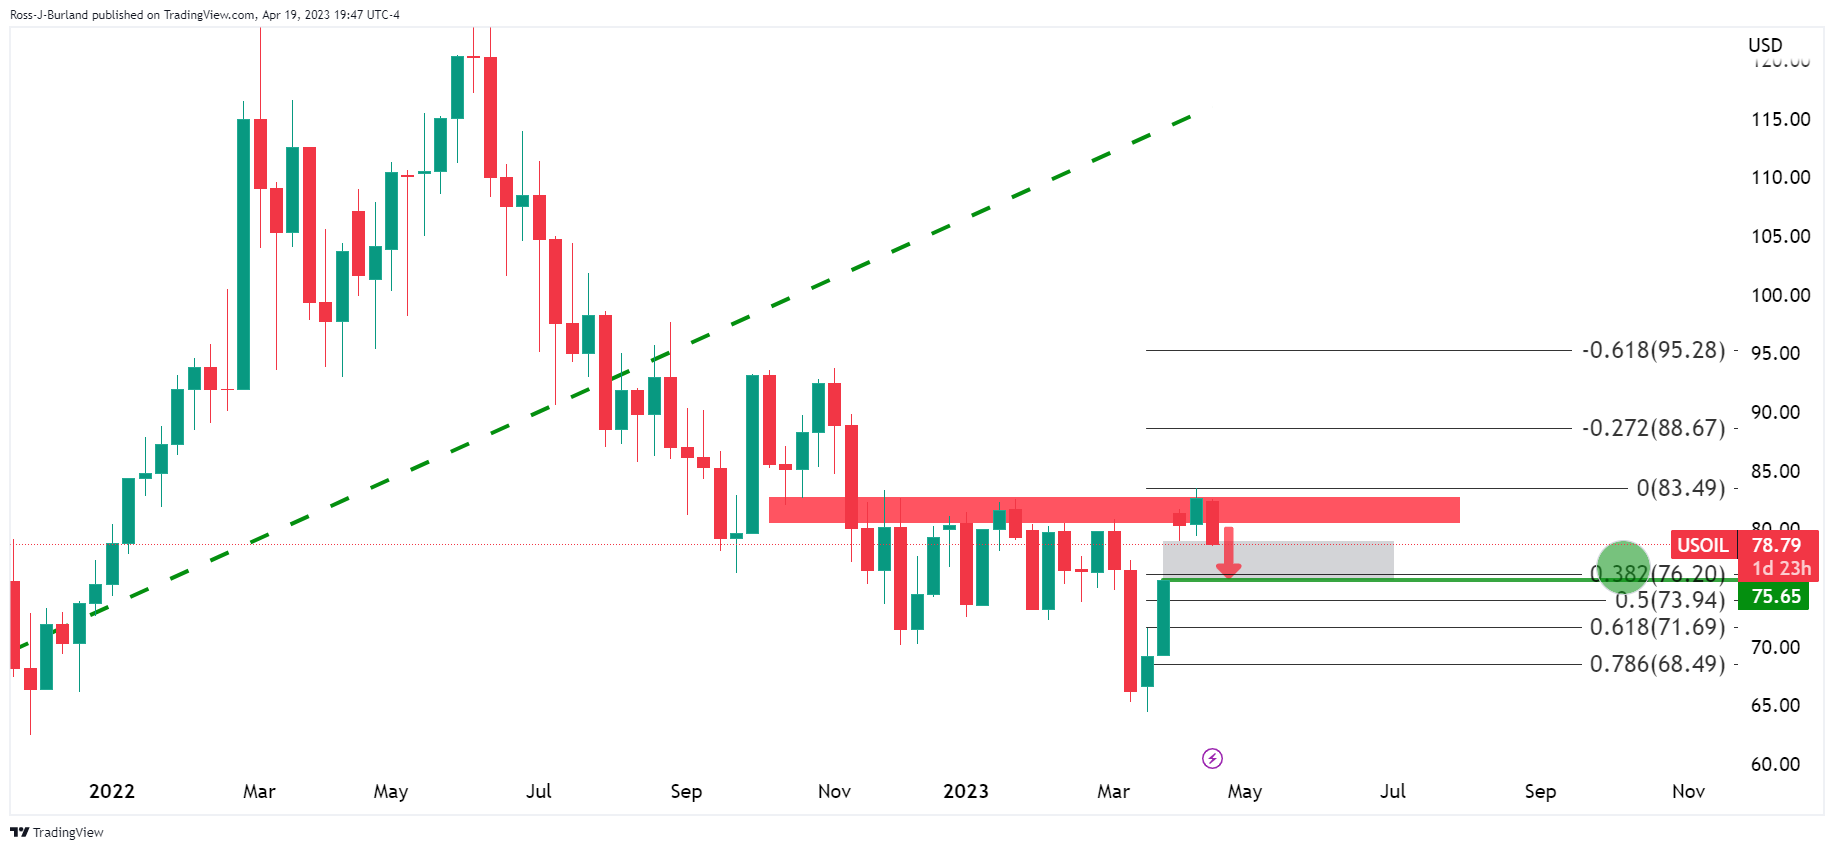
´´The bears are in and eye a 38.2%fibonacci correction towards a close of the gap at $75.65bbls.´´
WTI Update
(Click on image to enlarge)
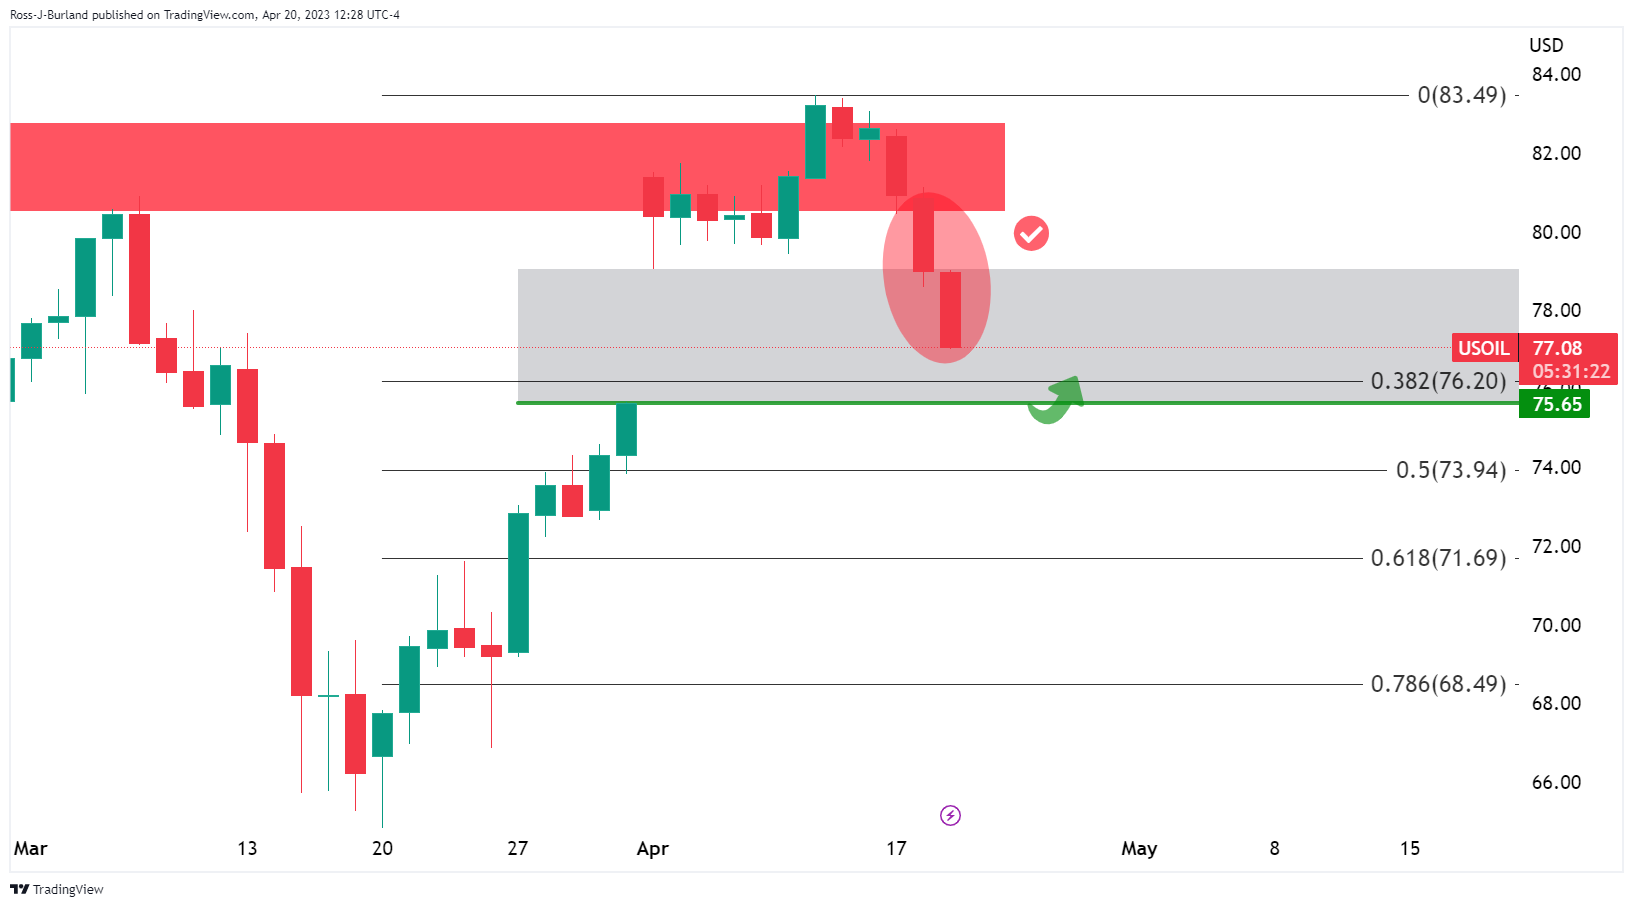
We are seeing a deterioration in price.
WTI H4 chart
(Click on image to enlarge)
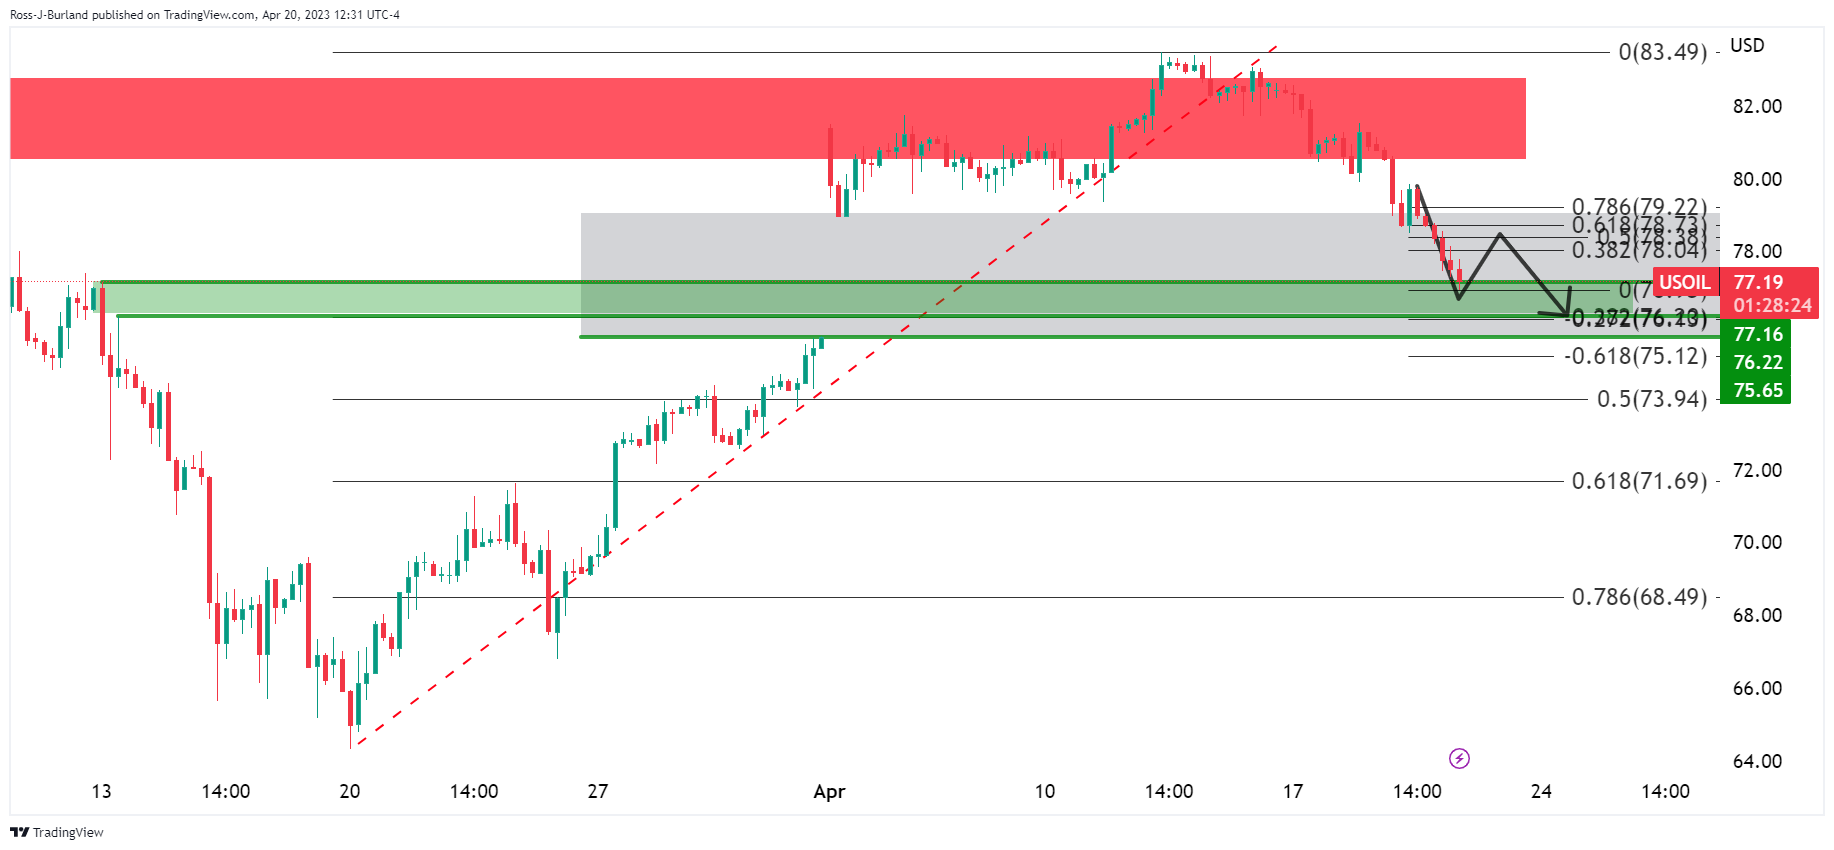
On the 4-hour chart, we can see the nearest potential support structure for while the price is currently moving into. This could produce a bout of profit-taking and a move up into the sell-off:
(Click on image to enlarge)
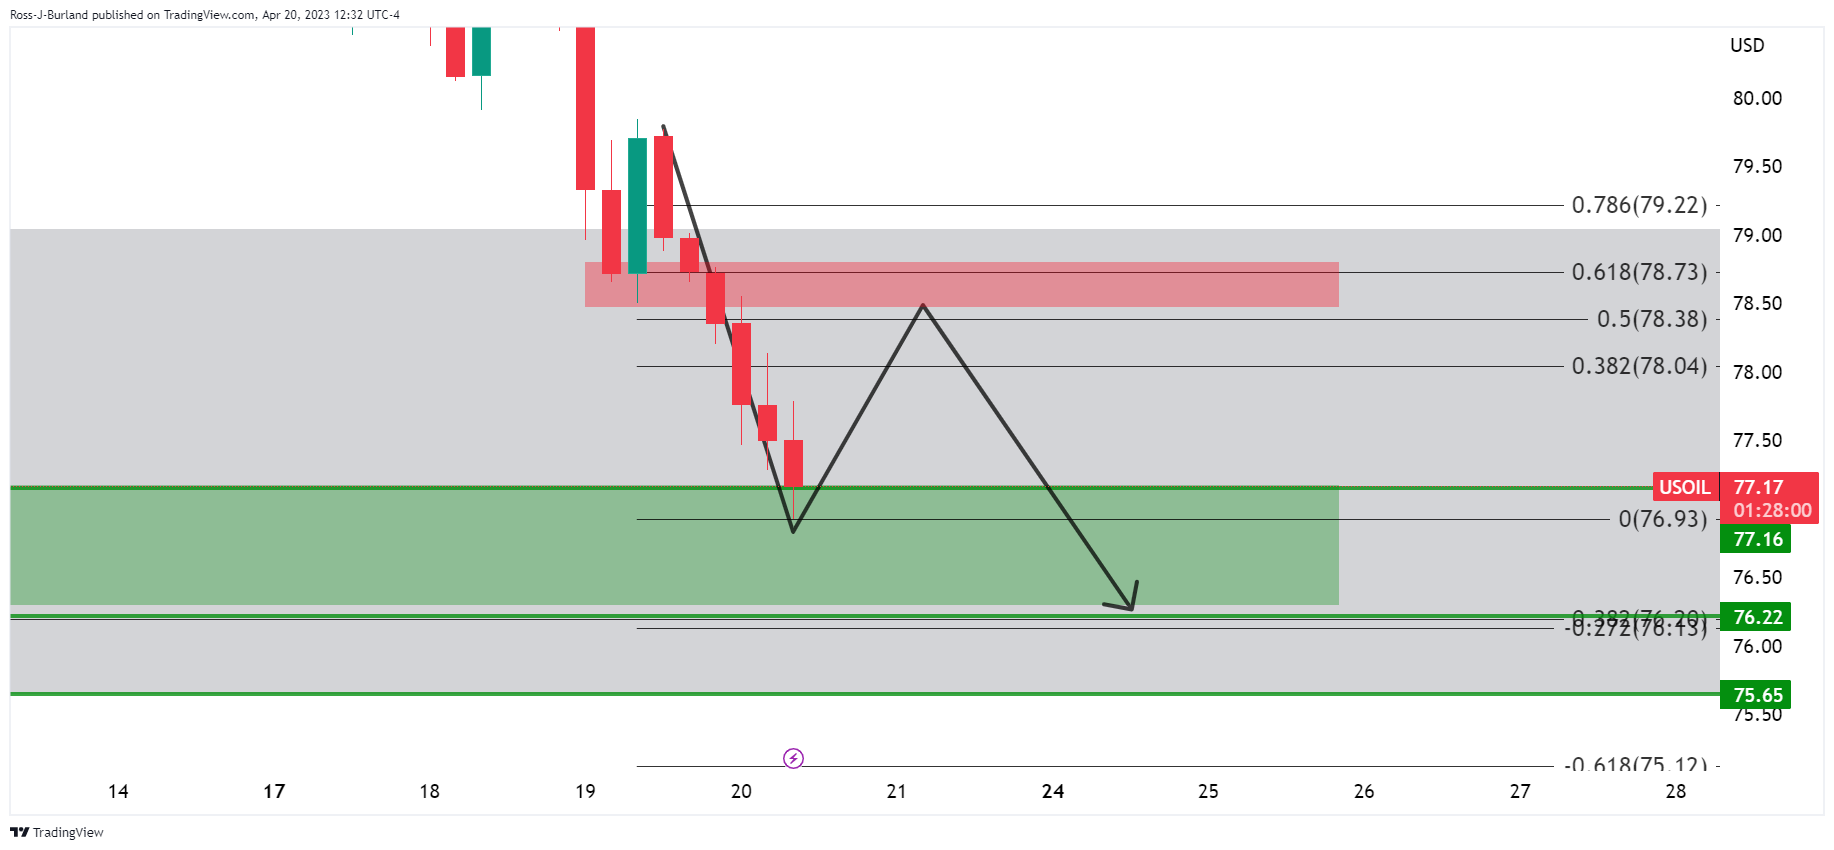
The prior support comes in at the 61.8% ratio near $78.70.
WTI H1 chart
(Click on image to enlarge)
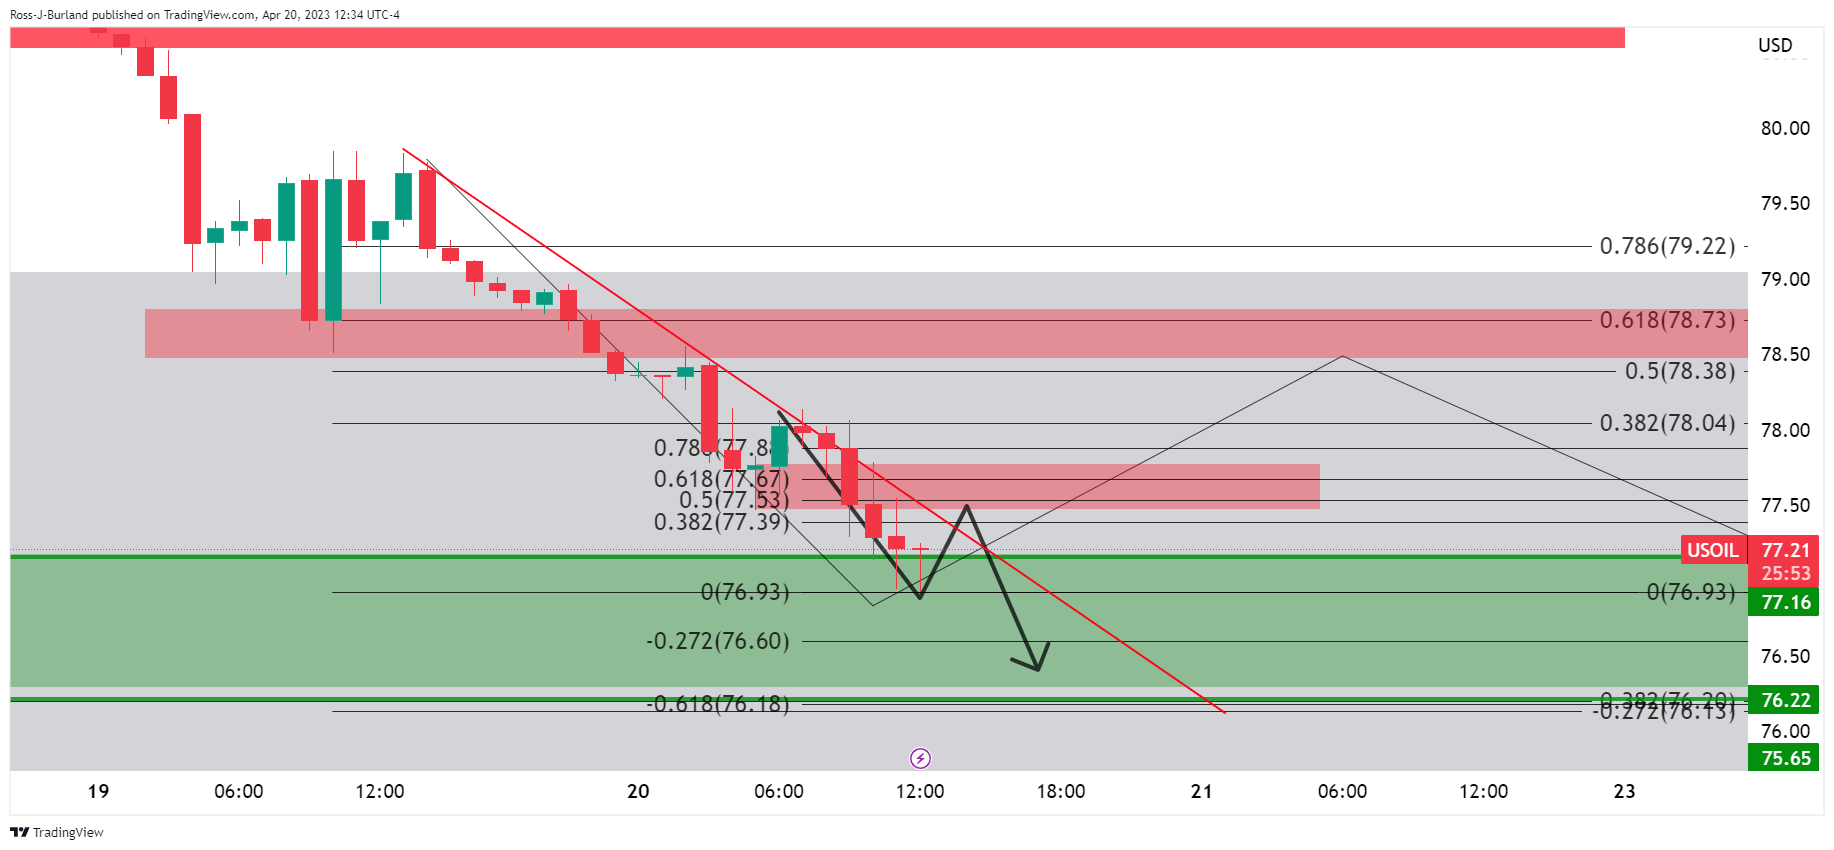
On the hourly chart, there could be a lower resistance as per the trendline resistance and the Fibonacci scale3 confluences.
More By This Author:
Johnson & Johnson Earnings: JNJ Breaks Above Resistance Following Q1 Beat, Targets $180
USD/JPY Price Analysis: Gaining Momentum On Rising US Treasury Bond Yields
Gold Price Forecast: XAU/USD Extends Slide To $1,980 Amid Dollar Strength



Comments
Log in or sign up to join the conversation.