
GBP/USD floundered on Friday, climbing a scant 0.13% on the day as the Pound Sterling gets weighed down by broad-market expectations of a rate cut from the Bank of England (BoE) next week. The pair wraps up the trading week down one-half of one percent, adding a second straight week of downside momentum as the pair pulls back from last week’s 12-month high above 1.3000.
The BoE is set to deliver its first rate cut since March 2020 on Thursday. The UK’s main benchmark rate is expected to shift down 25 basis points to 5.0% from the current 5.25%. Before that, the Federal Reserve (Fed) is due to deliver its own July rate call, and investors are broadly expecting the US central bank to keep rates pinned for one more meeting before kicking off a rate-cutting cycle in September.
The core US PCE inflation remained steady at 2.6% year-over-year in June, going against the median market forecast of a decrease to 2.5%. Additionally, near-term PCE inflation accelerated month-over-month in June, increasing to 0.2% from the forecasted 0.1%.
The University of Michigan's Consumer Sentiment Index dropped to an eight-month low of 66.4 in July, less than the anticipated 66.0 but still lower than the previous reading of 68.4. The UoM 5-year Consumer Inflation Expectations also rose to 3.0% in July from the previous 2.9%.
Despite indications of potential inflationary pressures, the markets chose not to worry about the figures and instead shifted towards a risk-on sentiment, holding out hope for a rate cut in September. According to the CME's FedWatch Tool, rate markets are still pricing in at least a 25-basis-point rate cut by the Federal Open Market Committee (FOMC) on September 18, with 100% odds of a hold on July 31. Additionally, there is a 12% chance of a 50-bps double cut in September by a contingent that is particularly hopeful for a rate cut.
British Pound PRICE This week
The table below shows the percentage change of British Pound (GBP) against listed major currencies this week. British Pound was the strongest against the Australian Dollar.
| USD | EUR | GBP | JPY | CAD | AUD | NZD | CHF | |
|---|---|---|---|---|---|---|---|---|
| USD | 0.24% | 0.36% | -2.29% | 0.87% | 2.11% | 2.20% | -0.44% | |
| EUR | -0.24% | 0.10% | -2.55% | 0.58% | 1.90% | 1.87% | -0.74% | |
| GBP | -0.36% | -0.10% | -2.75% | 0.46% | 1.80% | 1.76% | -0.88% | |
| JPY | 2.29% | 2.55% | 2.75% | 3.27% | 4.57% | 4.52% | 1.80% | |
| CAD | -0.87% | -0.58% | -0.46% | -3.27% | 1.32% | 1.30% | -1.32% | |
| AUD | -2.11% | -1.90% | -1.80% | -4.57% | -1.32% | -0.03% | -2.63% | |
| NZD | -2.20% | -1.87% | -1.76% | -4.52% | -1.30% | 0.03% | -2.56% | |
| CHF | 0.44% | 0.74% | 0.88% | -1.80% | 1.32% | 2.63% | 2.56% |
The heat map shows percentage changes of major currencies against each other. The base currency is picked from the left column, while the quote currency is picked from the top row. For example, if you pick the British Pound from the left column and move along the horizontal line to the US Dollar, the percentage change displayed in the box will represent GBP (base)/USD (quote).
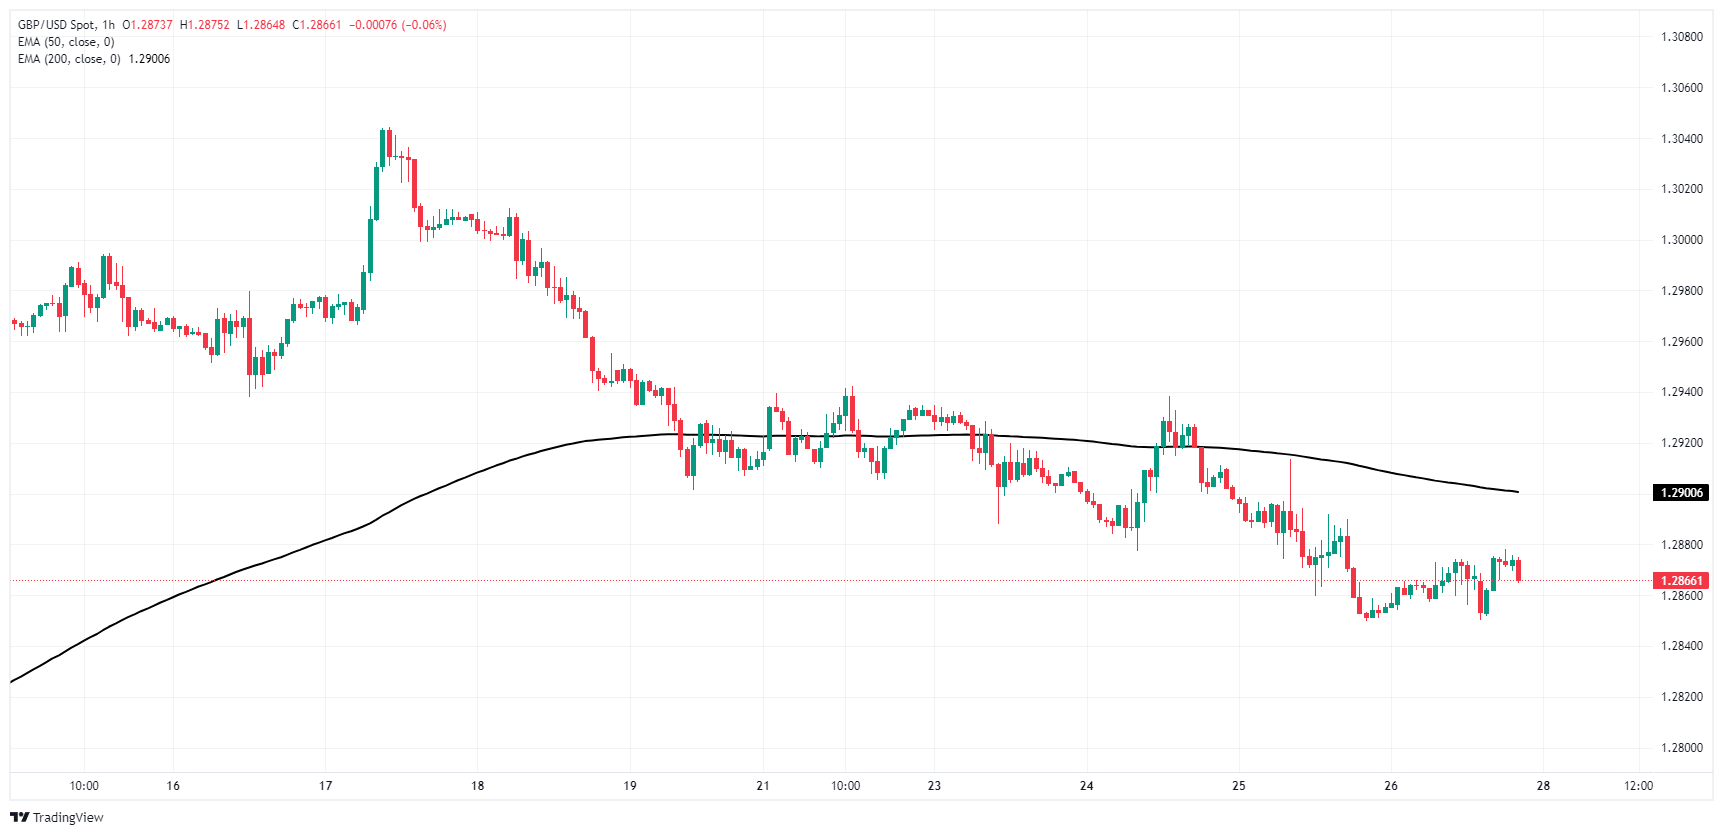
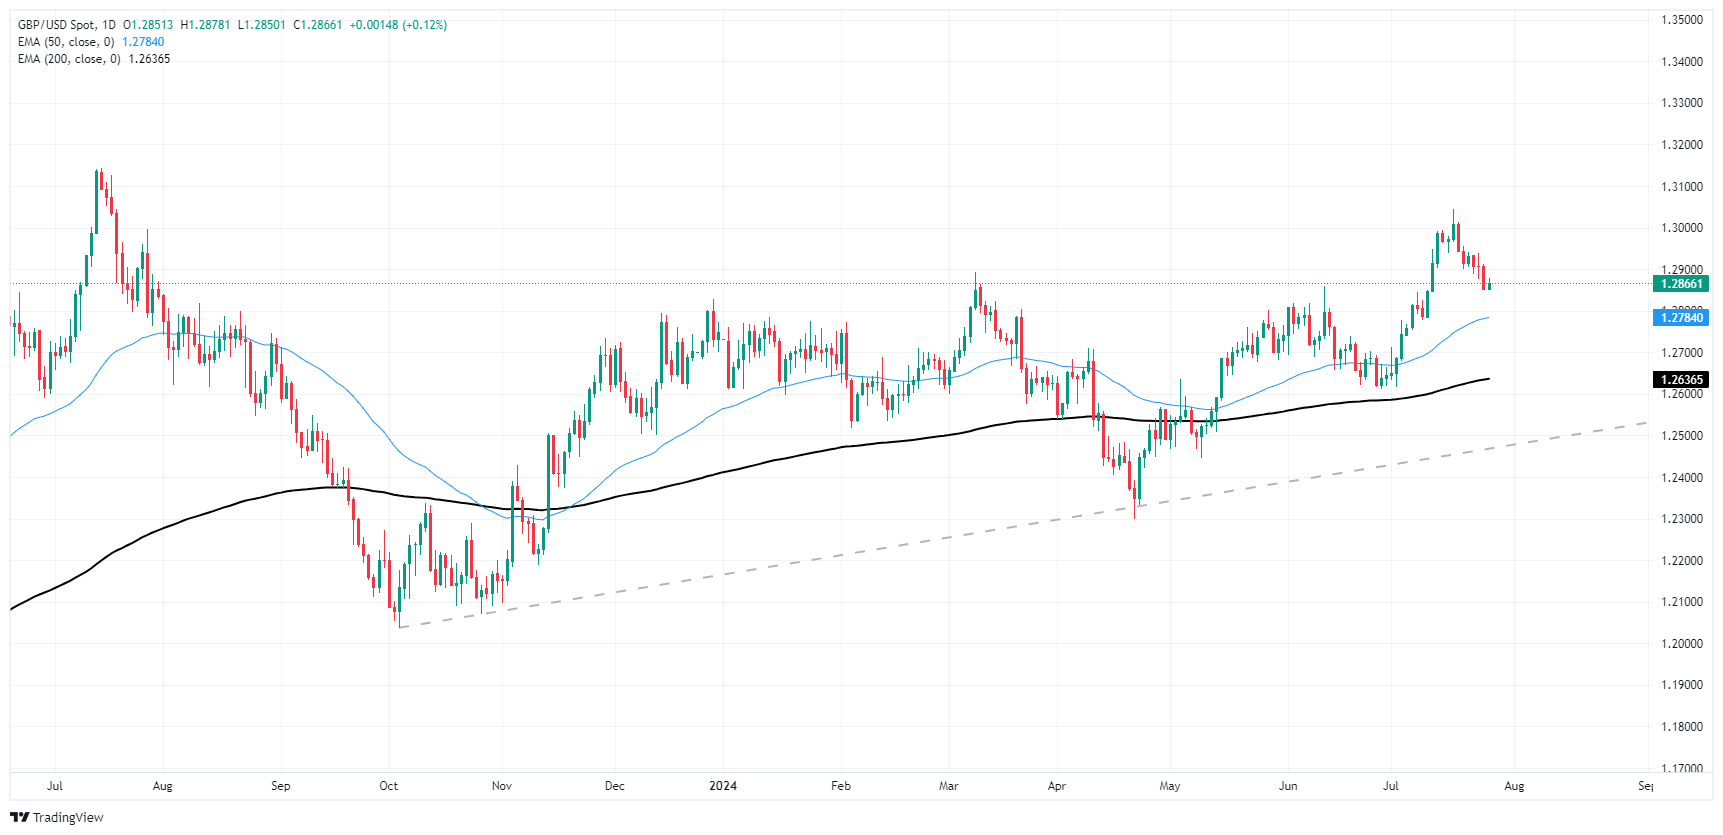
GBP/USD technical outlook
Cable has fallen back below the 1.2900 handle after backsliding from a 12-month peak near 1.3045 set last week. The pair is down around 1.5% peak-to-trough, but near-term momentum still leans in favor of buyers as price action holds on the high side of the 200-day Exponential Moving Average (EMA) at 1.2636.
Short pressure will be looking to force bids down below the last swing low near 1.2600, while renewed bidding could step in if GBP/USD declines far enough to tap a rising trendling drawn from last October’s bottom bids near 1.2037.
GBP/USD hourly chart
(Click on image to enlarge)
GBP/USD daily chart
(Click on image to enlarge)
More By This Author:
Canadian Dollar Soft On Friday As Markets Look Elsewhere
EUR/USD Backslides In Runup To Key Midweek Data Prints
EUR/USD Trapped Below 1.09 As Quiet Monday Markets Churn


Comments
Log in or sign up to join the conversation.