
- The GBP/USD exchange rate was hovering around $1.31 at the beginning of September, following a 2.1% gain in August.
- Primarily, this was driven by diverging monetary policy expectations between the United States and the United Kingdom.
- Weaker US economic data and hints from Federal Reserve Chair Jerome Powell about potential interest rate cuts weakened the US dollar, while stronger UK economic data and the Bank of England's cautious approach to further rate cuts boosted the pound.
(Click on image to enlarge)
")
Meanwhile, the Bank of England recently cut its main interest rate to 5%, and traders expect a further 41 basis points of cuts by the end of the year. In contrast, the Federal Reserve is expected to cut US interest rates by 103 basis points this year, with speculation of a possible 50 basis point cut next month. Also, UK Prime Minister Keir Starmer has warned of a slow recovery in the UK.
GBP/USD Weekly Forecast:
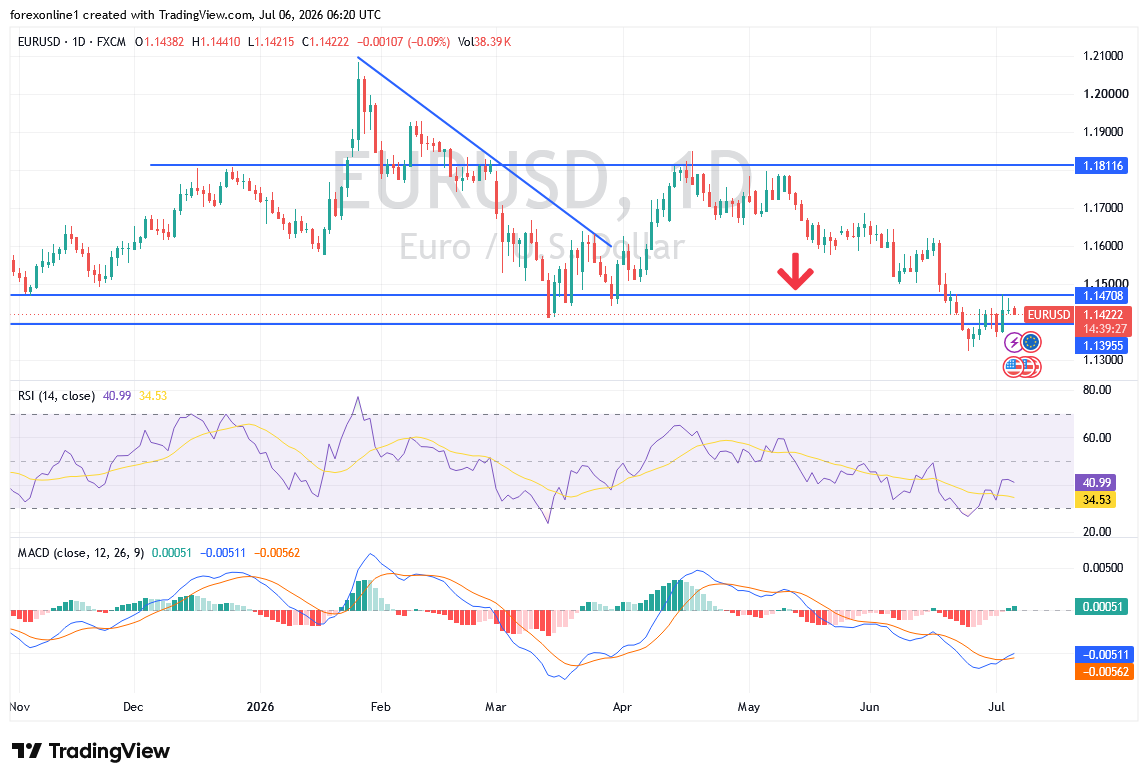
The GBP/USD bullishness could see a deeper setback this week if US Labor market data beats expectations. According to reliable trading platforms, the GBP/USD exchange rate peaked last week at 1.3266 but remained technically overbought after consecutive daily gains. It later fell back to 1.31 early on, where we find it at the start of the new week, and we can confirm that the Relative Strength Index (RSI) has once again dipped below 70, suggesting that overbought conditions have dissipated.
However, does this mean it can now start its upward journey? From a technical standpoint, the exchange rate remains constructive, and for now, any weakness will be considered superficial and a temporary respite in a broader upward trend. Therefore, dips towards the 1.3145 axis should be bought in the coming sessions. Given the overbought nature of the GBP/USD pair, we are looking to buy dips in the GBP/USD towards 1.3100, which faces strong resistance coinciding with the March 23, 2022, peak at 1.3298.
Technical forecasts for the GPB/USD pair today:
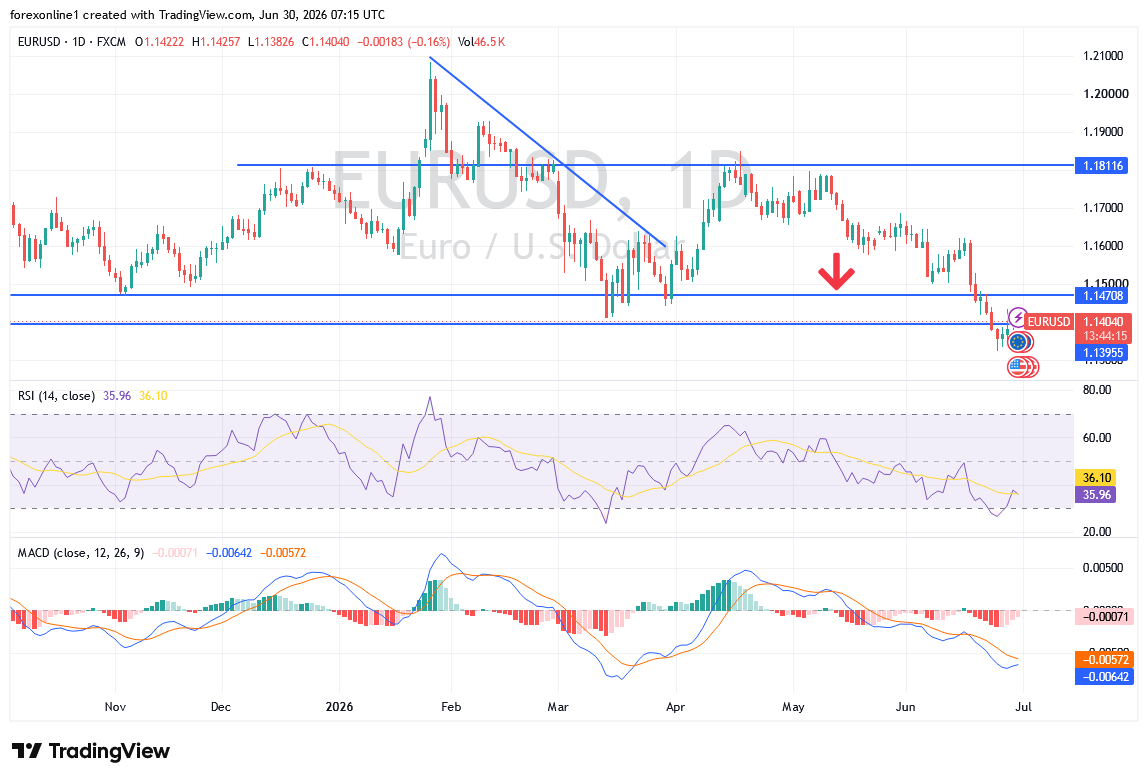
Now, we caution that any pullback could extend below 1.31 this week and potentially reach the 1.30 psychological level over a two-week timeframe. A study of the charts shows that previous pullbacks in the current cycle have tended to be quite large: the July and August pullbacks lasted three weeks, while the June pullback lasted two weeks.
A look at the daily chart shows that the 50-day moving average is where the previous two pullbacks faded, suggesting that any pullbacks could fall to the 1.29 support.
Overall, the duration of any GBP/USD pullback will depend on this week’s US data, which will determine the size of the Fed’s September rate cut. Also, a 25bp US rate cut in September has now been completely discounted by the market and explains the USD’s weakness in recent weeks. Moreover, the sell-off was also linked to rising odds of a 50bp rate cut, given evidence that the economy is starting to slow significantly. Therefore, we believe that the odds of a 50bp US rate cut could be further reduced by Friday’s stronger-than-expected US non-farm payrolls report, which could boost the dollar and weigh on GBP/USD.
More By This Author:
GBP/USD Analysis: US Holiday May Dampen Performance
USD/JPY Analysis: Yen Hovers Near Three Week High
USD/JPY Analysis: Yen Rises On Policy Divergence

Comments
Log in or sign up to join the conversation.