
Frothy Can Get Frothier – Also Means Protection Is Cheap
Yet another week and yet another record in the S&P 500, although the Russell 2000 is not in confirmation. Sentiment is complacent, some metrics frothy. But it can get frothier. This also means buying protection is cheap.
The US economy is in clear bifurcation – weak manufacturing versus consumers that are holding the fort.
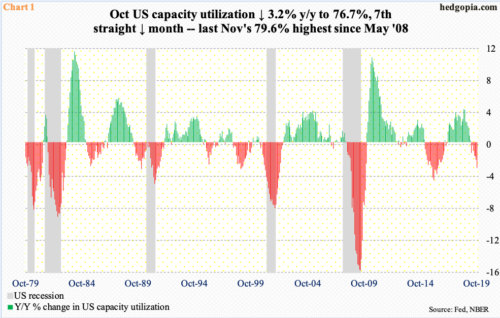
The ISM manufacturing index in October inched up five-tenths of a point month-to-month to 48.3 but has been in contraction territory the last three months. Manufacturing weakness is also reflected in capacity utilization.
Utilization in October fell 3.2 percent year-over-year to 76.7 percent. This is the 7th consecutive monthly decline (Chart 1). The cycle high 79.6 percent was recorded last November. This was the first time utilization peaked – assuming the current cycle has indeed peaked – under 80 percent.
Consumers, on the other hand, continue to open up their wallets.
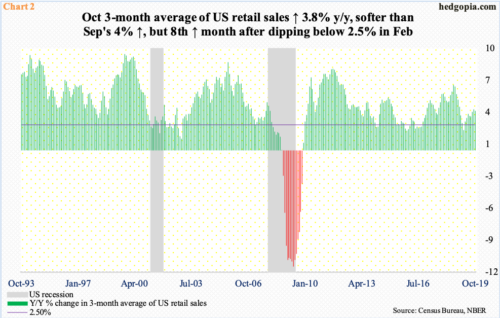
In October, retail sales rose 0.3 percent m/m to a seasonally adjusted annual rate of $526.5 billion, reversing September’s 0.3-percent decline. In the 12 months to October, sales grew 3.1 percent – 8th straight monthly growth of three percent or higher.
Chart 2 smooths out the monthly variation by using a three-month average. On this basis, in the 12 months to October, sales increased 3.8 percent, just under September’s four-percent pace – quite an improvement as growth had dipped under two percent in February.
Earnings expectations continue lower – not only because growth is sub-par but also because the sell-side customarily had high expectations early on and are now adjusting their numbers lower.
With 90 percent of the numbers in, 3Q blended operating earnings estimates for S&P 500 companies currently stand at $40.25, down nearly three percent from last year’s corresponding quarter. Ironically, when the quarter began, these companies were expected to bring in $42.47. Estimates progressively went lower as the quarter began and as the companies began reporting.
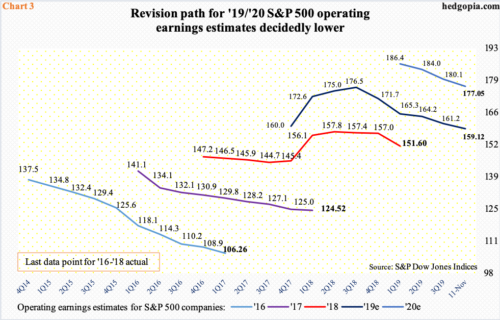
The trend is no different for 2019 and 2020 (Chart 3). Back in August last year, 2019 was expected to ring up $177.13, which has now been revised lower to $159.12. Similarly, in March this year, the sell-side expected $186.36 for next year, versus the current $177.05.
As things stand, the lowered earnings estimates have been more of a tailwind to stocks than a headwind. In 3Q, just under 75 percent have thus far beat the estimates – a four-quarter high. This is what the majority is currently focused on, not the downward revision trend. This is similar to investors overlooking the manufacturing weakness and treating consumer spending as the go-to signal.
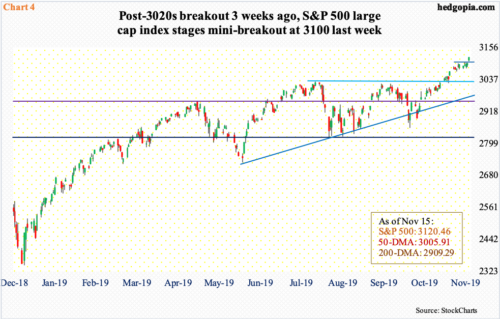
With this as a background, it is no wonder that last Friday the S&P 500 large-cap index (3120.46) staged a mini-breakout to yet another record. This preceded sideways action for several sessions. Still earlier, three weeks ago, the July high was taken out. Retest of this breakout takes place at 3020s.
Particularly since early October when the index bottomed, resistance fell one after another, even as bulls defended support, most notably shorter-term averages. On Wednesday and Thursday last week, the 10-day was defended, which led to Friday’s mini-breakout (Chart 4). In the six weeks since the October bottom, the index already rallied north of nine percent. Conditions are understandably overbought, with the daily RSI north of 74, but momentum remains with the bulls.
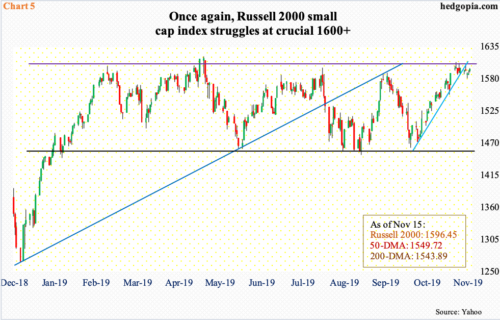
It is difficult to definitively say the same about small-caps, which investors, in general, tend to gravitate toward when they are in a mood to take on risk. From early October, the Russell 2000 small cap index (1596.45) is up just north of nine percent. In fact, through the intraday high of 1608.80 on November 5, it was up 10 percent. The index has essentially hit a roadblock.
Last week, the Russell 2000 gave back 0.2 percent, as opposed to a 0.9-percent jump in the S&P 500. This put an end to a streak of five up weeks, even as the S&P 500 is up for six straight. Small-caps are not confirming large-caps’ advance. This can change should the Russell 2000 decisively reclaim 1600-plus, which goes back to January last year. Since getting rejected in February this year, this was the fourth time this price point repelled breakout attempts (Chart 5). Bulls also lost a rising one-month trend line last week.
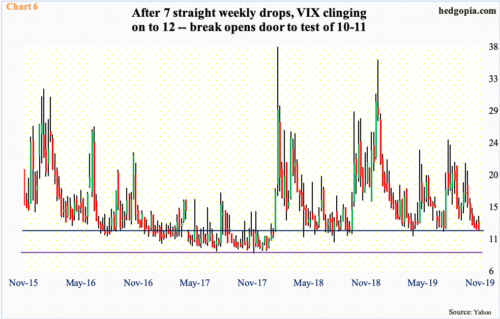
The divergence between small- and large-caps notwithstanding, the latter can continue to ride the prevailing momentum under at least one scenario. Not surprisingly currently, volatility remains suppressed. VIX (12.05) has gone from 21.46 on October 2 to last Friday’s intraday low of 11.92 (Chart 6).
In the futures market, non-commercials could not have ridden this downtrend any better. Late August, they were net short 57,153 contracts in VIX futures. By last Tuesday, this had grown to 206,157, for a third weekly record in a row (chart here) – their bet being the cash is still headed lower. Indeed, VIX’s daily chart is giving out vibes as if it does want to go lower in the very near term. There is support at 12, which is where it closed last Friday. After this, there is decent support at 10-11. VIX has not broken 10 since January last year.
Should this scenario come to pass, this will be another victory lap for non-commercials. Then we have this data point to remember. In the medium- to long-term, the cash historically does not peak until these traders either go net long or have substantially cut back their net shorts. But this is not where the focus is currently. The momentum is up in equities, and traders, in particular, are running with it. Several metrics are beginning to reek of excessive optimism, even froth. The question is, will it get frothier?
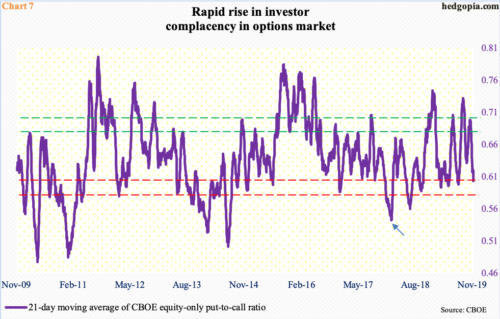
In the options market, the CBOE equity-only put-to-call ratio printed 0.49 last Friday, preceded by Thursday’s 0.47. In the last 16 sessions, there were 12 readings of 0.50s or lower, while three were in low 0.60s and one in low 0.70s. Calls are being snapped up left and right.
Consequently, the 21-day moving average of the ratio ended last week at 0.604, down from 0.699 on October 18; unless the ratio prints unity today, it is all but certain it enters high 0.50s. Historically, it tends to bottom at high 0.50s to low 0.60s (Chart 7). But several times in the past, it went lower still. Late January last year, it went as low as 0.543 (arrow). In a matter of a couple of weeks back then, the S&P 500 corrected nearly 12 percent. This is the risk building right now. Once unwinding is set in motion, nimble traders may be able to handle this, but not the average Joe and Jane. One possible antidote to this is to buy protection, which is cheap.


