
Happy Pre-Halloween and nice to have you back. Hopefully you had a “decent” investment week although it was the first down week for the S&P in the past 7.We mentioned the historical negative 3rd week of October in last week’s Market Outlook.The third week of October (especially in election years which is 2 weeks out of an important decision) tends to lean negative. If you have not had a chance to read last week’s Market Outlook or wish to reread it, please go here.
Stocks finished the week lower in most sectors with only technology stocks having a small gain.The Dow, the Nasdaq and the S&P all pulled back in the first half of the week, but later in the week, the Nasdaq staged a comeback and finished near its record high on Friday.
Much of the weakness of the markets, as mentioned right on cue, were focused on the nervousness of the upcoming election and each candidate’s posture on everything from entitlement programs, retirement benefits (Social Security and Medicare), taxes and the economic policies that could drive business worldwide.
But the market also had difficulty given longer-term interest rates continue to trend up to multi-month highs across the curve with the benchmark 10-year yield breaking 4.25% for the first time since July (more on this in a minute).
The manufacturing and services PMIs beat expectations along with durable goods orders, new home sales and the Richmond Manufacturing Index.This means that the domestic economy continues to show resilience and was, in my opinion, the main driver of the 10-year trending higher.
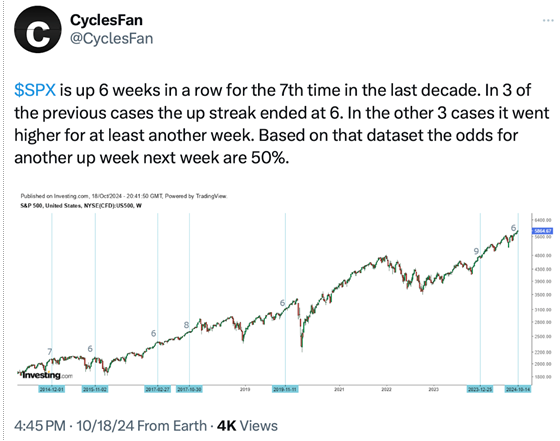
The S&P 500 snapped its six-week winning streak. It fell -0.96% for the week but remains less than 1% below record highs and is up 21.7% year-to-date.Nervousness around the election and upcoming corporate earnings made buyers vanish for most of the week.However, the momentum of the S&P 500 continues to be strong, as we cover in this column.
For the 12-month period, the S&P set a record of eclipsing a 40% return. This is a larger 12 month gain then anytime since 1954. See performance table below:
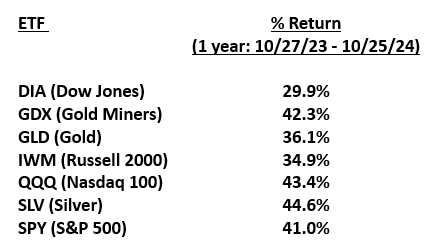
THAT’S CRAZY GOOD! It is important to realize that on average, the stock market goes up about 10% a year for its long-term average.From 2000 to 2010, the stock market basically had no return. Investors should also realize that having mid-teen returns (Oct 2020-Oct 2024) and almost 20% a year return for 10 years (October 2014 to current) is NOT the norm and we will likely see some sparse yearly returns in the next ten.
Where did the bulls go?
As mentioned above, this past week saw stock buyers vanish.The percentage of Bulls in the latest AAII Sentiment Survey fell to a six-month low of 38% this past week, down from 49% two weeks ago.Over the same period Bearish sentiment increased from 21% to 30%.
The Bull-Bear spread has been positive for 26 weeks now, making its longest streak since 2015.While the spread remains positive, this sentiment gauge has seen its worst two week drop in six months.However, the S&P 500 is on track for its best year since 1999; it’s less than 1% from record highs and we are entering a seasonally bullish time of the year.See illustrations below:


AAII (American Association of Individual Investors) chart below shows the very clear decline in Bullish sentiment.

Retail investor sentiment. Bulls outnumbered bears for the 26th straight week but the spread narrowed as the former dropped to a 6-month low.

Also, as mentioned above, there has been lots of anxiety about the upcoming election. However, I would suggest the reason for the stock pullback (besides the market’s getting ahead of themselves), is the better economic data being released (lowering further expectations of lower interest rates) and the quick jump up in higher long-term interest rates.See chart below:
Bond selloff. "Forget about the election. The bond selloff over the past month can mostly be explained by the better-than-expected economic news and the change of Fed expectations

At what point does higher rates begin to impact stock prices the most?
Yields vs. stocks. "Historically, it’s taken the 10-year Treasury yield posting a two-standard deviation move before stocks started to care. That’s a change of roughly 60 basis points in the yield within a month. Over the past 4 weeks, the yield has moved some 50 basis points."

Higher rates hurt Financial Stocks the most.
Even though tech stocks made a nice comeback late in the week, financial stocks, especially bank shares headed south.NY Community Bancorp was down 8.3% on Friday on a weaker outlook which contributed to Goldman Sachs dropping 2.3% and JP Morgan lost 1.2%.
With positive expectations for upcoming good earnings, Technology stocks marched higher last week.
The “Magnificent Seven” mega cap tech stocks had one of the best back-to-back jumps since February. The QQQ index is now hitting resistance, and the question is “can their upcoming earnings this week” push them into new uncharted territory?See the illustration below:

This is consistent with money flows for most of 2024.See illustration below:
YTD fund flows. Tech funds have dominated YTD flows while outflows have been concentrated in Healthcare and Energy.

Earnings Update: According to FactSet, 37% of S&P500 companies have reported their Q3 2024 results with 75% beating their earnings estimates and 59% reporting revenues above estimates.
S&P 500 market internals.
We wanted to provide some technical information to show you exactly where we are on a few of the many market internals we monitor daily.These various indicators all serve different purposes and occasionally they give early indications of cautiousness.If we were not so close to the two best months of the year to be invested, we might give some warning signals.However, not sure this would be helpful given the upcoming period from mid-November through to year-end.Historically this is a positive period, especially after major elections.We cover these points later in the Outlook.
S&P (SPX) Breadth (includes advancing versus declining positions and # of stocks above their 50/200 moving averages).
SPX breadth. 82.7% of S&P 500 stocks are trading above their 50MA, the highest since late March. 79.9% are above their 200MA, the highest since early April:

You also may not be aware that within our website is a section called “Big View”.There are so many hidden treasures within Big View that an investor can use to help make important and potentially profitable decisions.
With our upcoming launch of MarketGaugePro we have been building new tools to help investors (and professionals) understand all that Big View has to offer.One of the new areas is called “Color Charts”.These are impactful images that illustrate the “breadth” of the markets.We offer these images on different market indices and under various time periods.As an example, I offer two charts below to illustrate the signals showing recent market weakness.


Another interesting factor that could help the equity markets stay buoyant the remainder of the year is the number of Hedge Fund managers (and investment managers) that have remained under-invested in the stock market. They have incorrectly positioned their portfolios believing that we would be in for a correction or major market disruption in stock prices and then they could get more aggressive.See chart below illustrating hedge fund manager underweighting:
HFs vs. US equities. "Hedge funds remain significantly U/W US equities vs the market benchmark."

To make up for some under-performance, hedge fund managers recently have been “betting” heavily in Chinese equities.See chart below:

Should we be “scared”?
For Halloween, we probably should be.You might want to be prepared with plenty of candy to pass out and a good mask.Being scary should be part of the plan.
Regarding the stock market. Probably not.We have had a terrific year and hopefully we have a positive election with no problems.Afterwards, we should begin the post-election stock market enthusiasm that typically arrives mid-November.See the charts below, both very positive prognostications:


Finally, remember that we just celebrated a bull market anniversary that is only 2 years young.Given a resilient economy, a low chance of a near-term recession and earnings growth rates still in the 6-8% rate for the next quarter or two, we will likely see the continuation of a positive stock market into the end of the year.Then it might just take a breather.See chart below from one of our favorite analysts, Ryan Detrick who clearly wrote it before Friday’s close:

Thank you for spending your valuable time with us reading our thoughts from this week.The essential BIG VIEW bullets follow.We hope you have a good and “spooky” week ahead with plenty of investment profits to fill your pumpkins.
More By This Author:
Various Assets Extend Their Hot Streaks Can It Continue? (You Might Be Surprised)
China Goes Big And Fuels More Stock Market Gains
Unstoppable: What Does The Fed Know That We Don't?


Comments
Log in or sign up to join the conversation.