

Image Source: Unsplash
Last week we discussed the Fed’s new loosening monetary stance as they aggressively lowered the Fed overnight borrowing rate.If you have not had a chance to read or perhaps want to reread, you can go here.
This week, we want to delve into China’s actions this past week as they made it apparent to the world that they needed to stimulate their economy, and they were aggressive about going well beyond what our own Federal Reserve put in action the week before.
The effort by China is to revive growth in the country.Public sentiment had turned very negative, and many of China’s economic elite felt the need to pivot the country’s economic outlook and create a more consumer centered economy.
Earlier this week, China unveiled stimulus measures aimed at boosting the world’s second largest economy. These measures included a cut to the interest rate charged on its one-year policy loans, a drop in minimum property down-payments, a cash handout, and a recapitalization plan for many of China’s largest banks.
These actions immediately caught US investors’ attention and got them focused on the many Chinese stocks that are traded in the US market.Sentiment towards these stocks (and China) flipped in a matter of days.Most US investors, including hedge funds and institutions, had considered China “uninvestable” all year long.Suddenly, economists, analysts, and retail investors were coming out of the closet as China bulls.
It is important to note that the Chinese market and their respective US stocks have underperformed the S&P 500 over the last decade. Despite this week’s rebound, the long-term trend of China remains lower. These trend changes take a long time to materialize. But for this week, many investors reaped short term profits by taking a position (or being early) in several of the larger China- US listed securities.
There are a lot of investors worldwide who like to buy Chinese stocks.They have been patiently waiting for this week to eventually come.It reminds me of a song I know by one of the older rockers, Paul Rodgers, (who started Bad Company). As a solo artist, he produced a song called China Blue.You may have heard it. It has eerie guitar riffs.You may want to look it up on Spotify. The song reminds me of the many Chinese investors who like Chinese stocks but have been waiting a long time for them to do something. My heart will remain true to you while waiting for the green to turn to gold is symbolic, to me, of waiting for a return on my investment.
China Blue
Song by
Paul RodgersAnd will you wait for me as I cross the raging sea?
And I'll wait for you, China Blue
And will the stars looking down remember the sound
Of your tears in the wind, China Blue?And though the seasons may change from the green to the gold
But my heart will remain true to you.
Save your smile for the sun and your sighs for the moon
I'll save my love for you, China Blue
At the end of the week, China had its best week in over a decade.We follow this up with a few charts that illustrate just how powerful this China rally was.See below:
(Click on image to enlarge)


"Chinese equities on Tuesday saw the largest daily net buying since March 2021 - the second largest amount in the past 10 years". Hedge funds from around the world have been piling into Chinese equities over the past few days.

I found the following illustration quite humorous and so typical of investing trends.Many investors don’t want to buy “cheap” stocks until they become more expensive and potentially “breakout”.Such was the case this week with the Chinese stock “Alibaba”.See below:

The Baba example above does remind me of a relevant quote:
“It's better to be late and right
then it is to be early and wrong.”
- Brian Shannon
The China stimulus impact also fueled stock market gains throughout the world.Europe enjoyed one of its best days in two years.See below:

Given the close ties of the US stock market to Chinese companies and the strong interest by many US investors to catch an early trend, the Chinese announcement was met with heavy US buying of all stocks. Clearly, US investors are of the opinion that any stimulus in China will undoubtedly benefit our own economy. The more than 10% rise in many Chinese stocks also aided the S&P 500 to close at a new all-time high on Friday.See charts below:

The S&P 500 is trading with strong breadth. 82.7% of S&P 500 stocks are trading above their 50MA, the highest since late March. 79.9% are above their 200MA, the highest since early April. See chart below:

With only one trading day left in September, the S&P 500 is up 1.6% for what is ostensibly the worst month of the year to invest. It is also on track for a five-month winning streak.It has now been up in eight of the first nine months of 2024 and 10 of the past 11 months.
Years rarely reach September with only one negative month.This has only happened seven other times. See graph below:

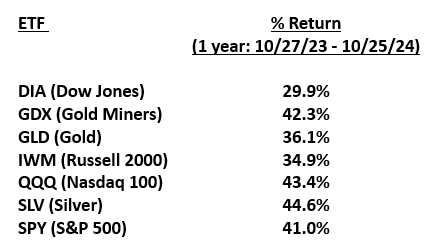
Which sectors are fueling the S&P 500 return for 2024?
As we have pointed out over the past few weeks, their has been a marked sector rotation going on the past two months.Investors took a breather with some of the larger magnificent 7 mega cap stocks and began investing in other areas including, but not limited to Utilities, Consumer Discretionary, Real Estate, and industrials (see below) and other sectors.Here is a summary of sector performance for the past month (from highest to low) and year-to-date. Taken from Seeking Alpha

The chart below shows the recent inflows coming into the markets.

Technology is still receiving a big share of inflows.
It has not been a particularly good month for technology stocks as evidenced in the table above.However, as noted, investors are still putting the bulk of new money into tech.This is due to the fact that some stocks have sold off, are more attractively priced, and they feel like they provide good value.Another reason cited is the optimism of the future development of all things AI.
A report released this week on the future of AI data centers showed that today’s cost of $1 to $2 billion will dramatically increase to more than $5-20 billion in the next 5 years. This immediately boosted Nvidia’s stock price.Here is what the semiconductor ETF vs S&P 500 chart looked like this past week as the price bounced off support and rallied.

More importantly, the S&P 500 has only had one negative month this year through September.All of the other times this has occurred, the S&P 500 continued higher in Q4 and January of the following year.Remember, September was “supposed” to be a bad month, but it has not been.This tells us that the underlying bid is unusually strong.It also speaks volumes about how good earnings have been (which we will cover in a minute).See chart of the S&P 500 below:

Fundamental return drivers. “I’m not sure you can call these new record highs sugar highs … Strong fundamentals in the corporate sector are driving returns more than just positive sentiment.”
Strong fundamentals, solid quarterly earnings and expectations for future positive earnings growth.
As we have said numerous times throughout the 2024 Market Outlook columns, this year is all about earnings, along with lower trending consumer inflation and interest rates much lower than earlier in the year. But the big driver has been, and should continue to be, earnings growth.
There are a number of reasons over the past two years that propelled earnings growth to come in higher than most analysts expected. I provide the following points to illustrate this:
- Post covid. We went through an economic shock which took several years to get back to an equilibrium, especially with supply chains.
- Rising inflation in 2022-2023 helped employees negotiate higher wages which has helped support consumer spending.
- Companies have been raising prices. This “change at the margin” stuck and helped ensure that these companies would be able to sustain higher margins and profits moving forward.
- The use of automation and better software has provided company efficiencies. Many of these efficiencies were developed during the Covid period as companies felt what might occur if they did not have enough manpower. Therefore, companies have learned to use automation to create higher productivity and less employment headcount. This helped improve margins.
- Companies have learned to be more efficient with raw materials.
- The US has evolved to become a service dominated economy, and many companies’ margins have transferred from selling products to selling services.
These are a few of the important factors contributing to much higher revenues, higher profitability, and higher earnings growth.We provide the following charts to illustrate the breakdown of margins, sales, and margin growth. See below:


This has been helping drive the US markets higher and is a strong catalyst for positive earnings growth the next few quarters.
CEO Outlook.
CFO optimism. "Despite increased concerns around the health of the overall economy and some uncertainty related to the upcoming election, respondents said they still expect employment and revenue growth in the third quarter."


As one can tell from the illustrations above, most CEO’s expect to stay on a steady growth trajectory on prices, steady unit costs and rising revenue expectations.This will also be aided by lower borrowing costs throughout the world due to the global easing and stimulas taking place.The only hesitancy we might have is that some analysts believe we will see a slowdown in global earnings.This answers why everyone around the world is mostly lowering interest rates.See chart below:
Global earnings revisions. "More analysts have downgraded than upgraded global expectations since late June."

In closing.We have reached Nirvana.
We wrap up this week’s commentary with the following chart by Ryan Detrick (one of our favorite market analysts).Ryan is always ready with a realistic but optimistic perspective.We are grateful for his work.Please see below:

If you were to go back and review the large number of Ryan’s charts and graphs we have used during 2024, you would notice that he repeatedly suggested that the rally had legs and would continue.Given the combination of a good first quarter and first half, along with more companies beating their expectations, we are likely to see additional gains in the US markets until year end.Spot on Ryan.
Thank you for spending a few minutes with us today.We hope that we have shined a light on some important market dynamics playing out.
Please make sure you join us next week as we introduce a new section of the Market Outlooks which will focus on some interesting facts.These brief facts should give you additional insight into Finance, the Markets, and the Economy.Two examples are as follows:
Six Weeks Left. Tuesday, 9/24 marked six weeks left until Election Day 2024. In the six U.S. Presidential election years since 2000, the S&P 500 has averaged a decline of 3.7% (median: -0.6%) in the six weeks prior to Election Day with declines four out of six times. (Source: Bespoke)
They're Pampering the Pets. Americans spent $186 billion on pet products and services in 2023, which was more than they spent on childcare. Consumer spending growth on pets has outpaced the overall rate of spending growth in every year since 2011 - the longest streak since at least 1960. (Source: Economist, Bureau of Economic Analysis)
Have a good, profitable, and safe week.
More By This Author:
Unstoppable: What Does The Fed Know That We Don't?
The Door Is Open, Time For The Fed To Act
Slowdown Ahead - How Much Will They Cut?

Comments
Log in or sign up to join the conversation.