

We are happy to have you back with us. We hope that you had a good week in the markets, as we watched most of our models outperform during this snap-back rally.
The Door is Open
Investors have been anxiously waiting for the Fed to “take action” and reverse the interest rate tightening they began in early 2022. This past week, new “data” came out that showed a continued decline in wholesale and consumer prices.
With the CPI trending down and heading in the right direction, most economists and investors are optimistic that the door is wide open for the Fed to lower rates. Economists, analysts, and investors are all waiting for Fed Chairman Jerome Powell and his group of Fed Governors to begin to reduce the restrictive borrowing costs.
There are plenty of intelligent guesses as to how much the Fed may reduce rates. Most estimates are for a 25-basis point reduction, although there are plenty of people who feel that rates have remained so high that the economy could use a 50-basis point reduction to start things off.
We reviewed several potential scenarios last week. Whatever the Fed decides, we do not think that “doing nothing” is a productive solution. Yes, inflation remains sticky and elevated, but with a 200 to 250-basis point spread between the Fed borrowing rates and the rate of inflation (trending down), they must do something.
One last point about this: many forecasts are predicting a 125-150 (1.25-1.50%) basis point reduction in the Fed Fund rates by year-end 2024. We think that this is an overly aggressive estimation of what might occur. We would be in the camp that maybe we will see 75-100 basis points of reduction.
A Review of The Markets
After one of the worst weeks post Labor Day (Sept. 3-6), especially in the tech heavy Nasdaq (QQQ) as well as small-cap stocks (IWM), the market recovered. We saw the exact opposite action from the previous week with five up days for the S&P 500. Additionally, we saw a rebound in chip stocks. Small-cap stocks must have gotten the memo that interest rates are about to decline soon, as they blasted off, especially on Friday.
Perhaps the most startling example of the bullish nature of the markets this past week was on Wednesday when all the markets were in steep declines from the opening bell onwards (Dow down 600+ points intraday), only to turn midday. The major indices finished up at the close. See chart below:

So far this year, these sudden and dramatic course changes have been followed by almost a mirror image of bullish activity, as investors are pushed out and then pulled back into the markets.
Also, just based on volume spikes, one could see that retail investors have been quick to pull the plug on short-term profits and become heavy sellers, only to discover a few days/weeks later that they need to put the money back to work. See below:

There is a sense that when investors sell and see the market turn around and head higher, they experience the fear of missing out. See the chart below, which shows this during the past 25+ years:

In the above chart, Jason points out that when a big, weekly reversal occurs near a new high, the S&P 500 has historically had above-average returns. Since 1957, 10 other significant reversals have occurred within 3% of a 52-week high (-3% weeks are followed by +3% weeks). This is what happened in the past two weeks.
Looking out over the next three months, the S&P 500 has been higher 90% of the time, by an average of +5.2% versus a typical three-month average of +3.5%. After recovering 4% from the previous week’s -4% loss, over the decades similar reversals have been more bullish than bearish for the market. Another good chart to illustrate this from our reliable source, Ryan Detrick, is below:

Another good illustration of what occurred this past week is contained in the chart below. This shows the recovery in the indices as well as the chip stocks (SMH) and biotechnology (XBI). I like that these two areas are highlighted, given Mish’s emphasis on these two sectors of the market.
Mish recently pointed out that these are two vital areas showing “risk-on” sentiment, as well as the health of the economy and the markets. This robust recovery in stock prices, especially within these two areas this past week, bodes well for the longer-term health of the markets.

The summary of the above chart is that the short-term trend of the market has turned higher. These 4 ETFs had all fallen below a declining 5-day moving average and are all now above a rising 5-DMA. For this to occur in September, and with an upcoming potential loosening of the Fed overnight lending rates, is a sign of a more positive and bullish near-term trend, these analysts believe.
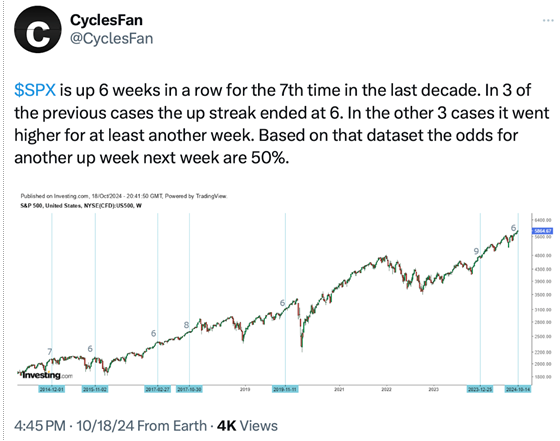
We mentioned last week that Sept. 8-18 tends to be a more positive period in the difficult month of September. The jury is out as to whether or not this will inevitably be the negative month that many investors expected. Here is a fun statistic for the week. See chart below:

What is Driving the Market’s Return?
There are several factors driving the market's return. In these weekly outlooks, we try to identify the main drivers of the stock market. Let’s review a few of the most important drivers so far in 2024:
- The economy remains on solid footing. After plenty of prognosticators predicting that we would go into a recession, it has not happened (yet). Most of these pundits used the inverted yield curve, elevated price-to-earnings ratios, a higher regulatory environment, slowing GDP, geopolitical stress, and possible military scenarios playing out around the world as reasons we should see a recession.
- Inflation is heading down towards the Fed’s 2% target. We have all been under the punitive effects of higher costs for just about everything. Wage growth has been positive but probably not keeping up with the pace of inflation. Nonetheless, the mere fact that it is on the decline has helped fuel a positive environment for stocks.
- Forecasts for interest rate declines. This has been discussed since April and while it has not happened yet, this week’s potential Fed action has already contributed to driving stock prices higher. Most analysts have begun to factor in a potentially 100 basis-point reduction of interest rates. The fact that interest rates have come down (dramatically) by market forces has also helped steer money into risk-on assets and stocks.
- I believe TINA is still alive and well. That stands for "There is No Alternative." Other markets, including fixed income securities, are only up in the low single digits. Investors are always targeting the best potential return markets. As Mr. Wonderful says on Shark Tank, "money goes where it is treated the best."
- We are in an election year. Of the four-year presidential cycle, the fourth year is second best. Given many of the metrics we have provided throughout the year about what happens when the first quarter is positive, coming off a positive third year (the best in the cycle), etc. we were expecting to have a positive and healthy stock market.
- The biggest reason the stock market is doing well is that earnings have been coming in better than expected. This will always be one of the main drivers of stock market performance (along with declining interest rates and declining inflation). To better illustrate just how good the 2024 corporate earnings have been, we provide the following chart:

-
The last point that may be driving the stock market higher is the use of AI in many different industries and the application of AI to produce additional corporate efficiencies. We offer the following chart to illustrate this:

A word of caution going forward (and a reason that the Fed could get more aggressive in reducing rates over the next year) is that estimates of corporate earnings are starting to look precarious, with potential slowing of earnings “beats” in the next few quarters. See chart below:

Can the Stock Market Hold Up?
With all the positive superlatives noted above, the near-term market outlook still looks fuzzy to us, and it may require remaining nimble and exercising a fair degree of risk management. The risk appetite is starting to slow, no matter how robust this past week’s performance was.
We also note that people like Warren Buffet (who sold a large stake in his biggest company positions) are moving to cash. These small bits of information remind us that we have had a very good run in the stock market since the fall of 2022, and we will eventually see a prolonged correction or even a bear market.
Here is some additional data on the Investment Manager Index, which recently came out showing some level of concern among investment managers as they are looking into the near future.


Summary
This writer and this company like to present different perspectives of the markets and the economy. Therefore, while we are showing charts with a positive bias, we also want to provide a few that may present similar data in a different light. This is why we take up space showing different points of view for your consideration.
It is also why we utilize rules based, quantitative built models that run on algorithms that factor in bullish, bearish, and neutral investment patterns. They are not always right, but if you look at the longer-term (three to five years or longer), they would have delivered market beating returns with less risk.
We end with a bullish prognostication of the S&P 500 and the gold markets. See below:

Finally, a Note on Gold
I vividly recall traveling with Mish to The Money Show back in October 2023. She led several sessions addressing the Show’s attendees about using the our tools. She also sat on panels where she shared her views on the markets and where she would invest money for the remainder of 2023 and for 2024. She does a great job, and this why she is often featured on National TV shows like Charles Payne on Fox Business.
During the conference and on her numerous TV appearances, and without equivocation, she was pounding the table for investors to take a position in the metals, including gold (GLD), silver (SLV), and the gold miners (GDX).
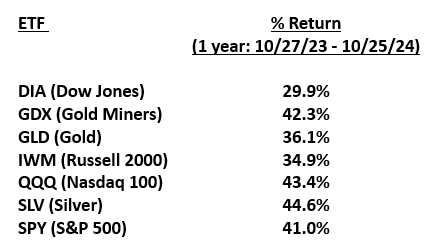
I wanted to highlight this because gold and gold miners made new yearly highs this past week, and the GLD ETF marked a new all-time high. To put this in perspective, see the table below:


I hope that this outlook has uncovered a few points and facts you may not have been aware of. Our goal is to provide observations of the economy, government policy, and the markets and what effect they may have on your own investment portfolio in the future.
We all hope you have a successful investment week ahead.

Every week, we review the big picture of the market's technical condition as seen through the lens of our data charts. The bullets below provide a quick summary organized by conditions we see as being risk-on, risk-off, or neutral.
Risk-On
- Stocks saw an amazing recovery, rallying between +2.5%-6%, with all four major indexes now in bull mode.
- With the exception of energy, all market sectors were up, led by the recovery in semiconductors, consumer discretionary, and home builders. 10 of the 14 sectors we track are in bullish phases.
- The McClellan Oscillator moved back above neutral into positive territory, and the cumulative advance decline hit a new recent high.
- The charts have a positive read for the S&P 500 and Dow. The Nasdaq looked to be neutral to negative.
- The percentage of stocks above key moving averages flipped positive this week, both on an intermediate- and short-term basis.
- Growth regained its bullish phase. On a relative basis, growth and value are matching each other.
- Interest rates at all parts of the yield curve consolidated their recent gains, indicating the market believes the Fed will significantly reduce rates in the coming months.
- Foreign equities regained their bullish market phases, though they are underperforming the U.S. equities.
Neutral
- Volume patterns moved up to a neutral reading, and only the S&P 500 had more accumulation days than distribution days.
- In terms of pure momentum, the four indexes are showing a wide divergence from price action, as real motion is showing bear phases in three out of the four indexes.
- Gold miners, silver, and gold all experienced explosive moves, with gold hitting new all-time highs.
- The 52-week new high/new low ratio is giving a mixed read.
- Volatility remains elevated, but it seems to be trending down in the short-run.
- Commodities had a strong week, led by gold and silver. DBA hit a multi-month high.
- Oil is in a distribution phase, with its momentum slowing down. It is a bit oversold, subject to mean reversion, and retesting the 200- and 50-day moving averages.
Risk-Off
- Risk gauges remain fully risk-off.
More By This Author:
Slowdown Ahead - How Much Will They Cut?We Are in the Period of Hot Air and Blue Skies, But the Month of September is Ahead!
Markets Take Off On Another Win Streak, & The “Other” Asset Class You May Be Missing

Comments
Log in or sign up to join the conversation.