
According to the CME, peak Fed funds will be achieved tomorrow. So… “25 and done”…
(Click on image to enlarge)
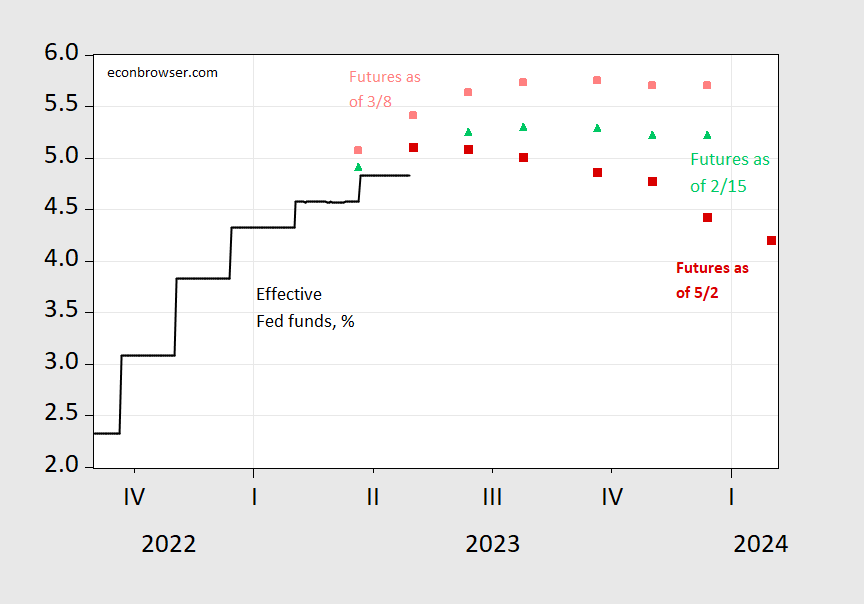
Figure 1: Effective Fed funds (black), implied Fed funds as of May 2, 5 PM CT (red square), March 8, (pink square), February 15 (light green triangle). Source: Fed via FRED, CME Fedwatch, and author’s calculations.
Between mid-February and early March, higher-than-expected inflation pushed up the expected trajectory of the Fed funds rate. After March 8, SVB and other banking woes have pushed down the anticipated trajectory.
The currently projected peak of 5/3 is earlier — and lower — than that of 9/20 anticipated in the March 8th futures. While this peak value is lower than the modal response of between 5.5%-6% in the mid-March FT-IGM survey, the timing (modal response of Q2) matches.
More By This Author:
Business Cycle Indicators - Tuesday, May 2Unexpected Compression
The Godot Recession


Comments
Log in or sign up to join the conversation.