
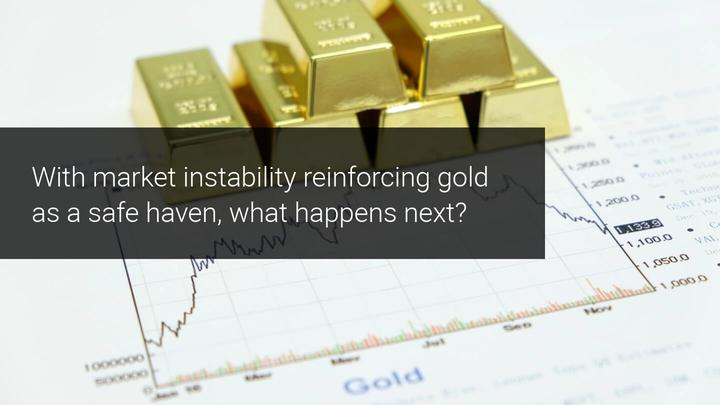
Fear Of Inflation And The Weak Dollar Drive Gold
As we mentioned in yesterday's analysis, the fear of the possibility that inflation will skyrocket in the United States has been installed again in the financial markets, causing widespread falls in the main stock indices around the world, triggering the well-known VIX volatility index above 22 points. This instability in the market has driven gold in recent sessions, thus reinforcing its status as a safe haven.
For its part, as we mentioned in the technical analysis on Monday, the dollar index yielded 2.11% against the main currencies during April. Consequently, this favors the rebound of gold from the annual lows, after making a double bottom formation in the vicinity of the 61.8% Fibonacci retracement level from the highs reached on August 7, 2020. This movement can be explained thanks to the strong negative correlation that we can observe in the correlation matrix between the dollar and gold.
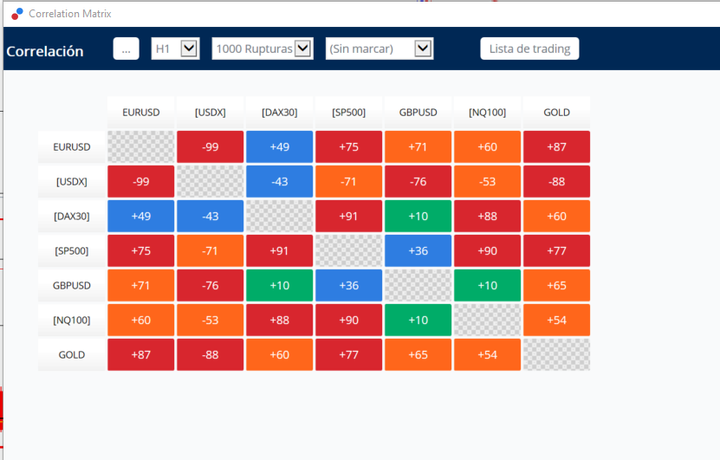
Source: Correlation Matrix of the MetaTrader 5 Supreme Edition platform Admirals
Technically speaking, gold is the safe-haven asset par excellence and if we look at the daily chart we can see how, after the last decreases in the stock markets, it has experienced a strong boost. This has led its recovery to levels above $1,845 per ounce, after finally exceeding its important average of 200 sessions in the red that acted as its main resistance level after confirming the breakdown of the bearish channel, making a pullback to its average of 18 sessions in black.
This new bullish momentum is causing a cross of bullish averages that could confirm the change in trend. As a result, it could further push the price in search of its current main resistance level, in the green band.
Currently, we can see that its stochastic indicator is at overbought levels, so we cannot rule out that the price may make some correction in search of support to gain momentum.
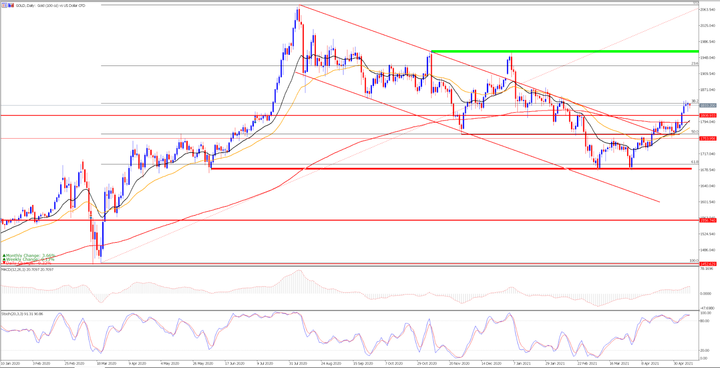
Source: Admiral Markets MetaTrader 5. GOLD daily chart. Data range: from January 10, 2020 to May 12, 2021. Prepared on May 12, 2021 at 11:20 am CEST. Keep in mind that past returns do not guarantee future returns.
Evolution in the last 5 years:
- 2020: 21.86%
- 2019: 15.45%
- 2018: -3.22%
- 2017: 12.75%
- 2016: 10.12%
Disclaimer: The given data provides additional information regarding all analysis, estimates, prognosis, forecasts or other similar assessments or information (hereinafter ...
more

