

Existing-home sales data from the NAR via St. Louis Fed download
The National Association of Realtors® NAR® reports Existing-Home Sales Slipped 2.2% in July
Highlights
- Existing-home sales fell 2.2% in July to a seasonally adjusted annual rate of 4.07 million. Sales receded 16.6% from one year ago.
- The median existing-home sales price rose 1.9% from one year ago to $406,700. It was the fourth time the monthly median sales price eclipsed $400,000, joining June 2023 ($410,000), June 2022 ($413,800) and May 2022 ($408,600).
- The inventory of unsold existing homes increased 3.7% from the previous month to 1.11 million at the end of July, or the equivalent of 3.3 months’ supply at the current monthly sales pace.
- First-time buyers were responsible for 30% of sales in July, up from 27% in June and 29% in July 2022.
- All-cash sales accounted for 26% of transactions in July, identical to June but up from 24% in July 2022.
Existing Home Sales Seasonally Adjusted

Existing-Home Sales Month’s Supply

Existing Home Sales Long Term

Existing-home sales chart courtesy of Trading Economics.
Transaction Crash
Existing home sales have crashed to a level seen in the mid 1990s. Prices have not crashed but transactions have. Crashes are rare, but we are in one now, from a transaction perspective.
People who want to move are effectively trapped in their houses because they do not want to trade a sub-3% mortgage for a 7.0% mortgage.
The bidding wars we do see are from people who are price insensitive. They make for amusing anecdotes but the above chart shows the real picture.
This crash is likely to last longer because intertest rates are likely to stay higher for longer because the Fed fears stoking more inflation.
Home sales mean appliance sales, new furniture, cabinets, new carpet, landscaping, etc. Who doesn’t spend a lot more money when they move into a new home?
The Housing Bubble Is Expanding Again
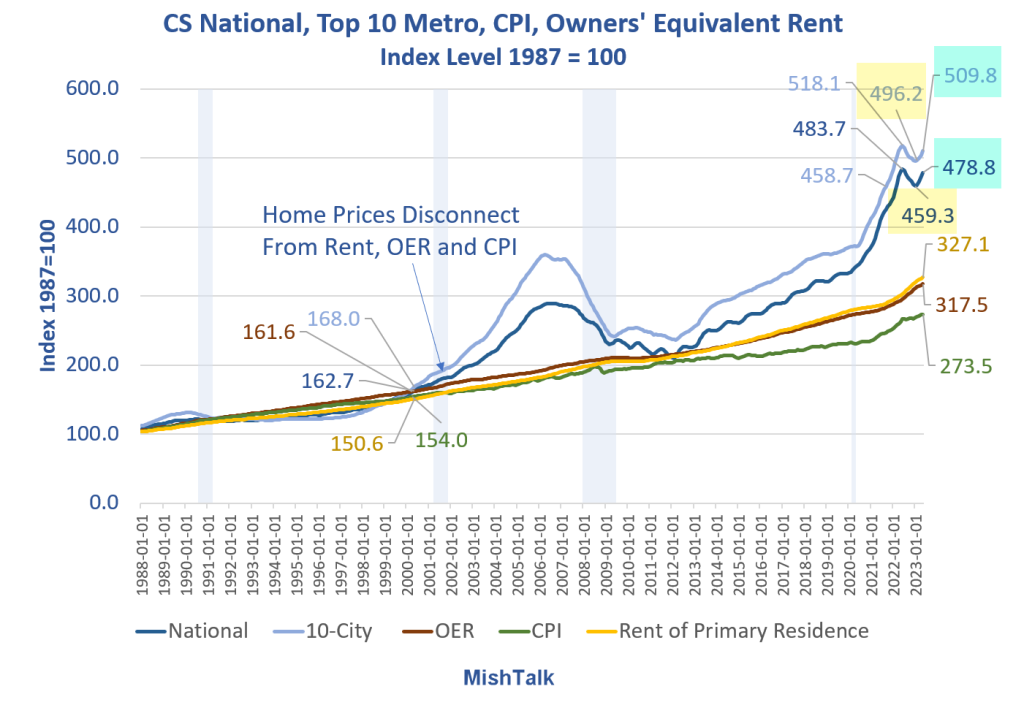
Case Shiller National and 10-City home prices indexes plus OER, CPI, and Rent indexes from the BLS.
Chart Notes
- The latest Case-Shiller home price indexes is for May. It represents repeat sales of the same house in roughly a March-April timeframe.
- OER stands for Owners’ Equivalent rent. It’s the price one would pay to rent one’s own home, unfurnished, without utilities.
- CPI is the consumer price index.
- Rent of primary resident is just what it sounds.
- CPI, OER, and Rent as as measured by the Bureau of Labor Statistics (BLS).
Home prices wildly disconnected from the CPI in 2000 and in 2013. The disconnect accelerated in 2020.
After a two-month decline in most markets, prices are again on the rise.
For discussion, please see The Housing Bubble, as Measured by Case-Shiller, Is Expanding Again
How Much More Will Homebuilders Have to Reduce Prices to Increase Sales?
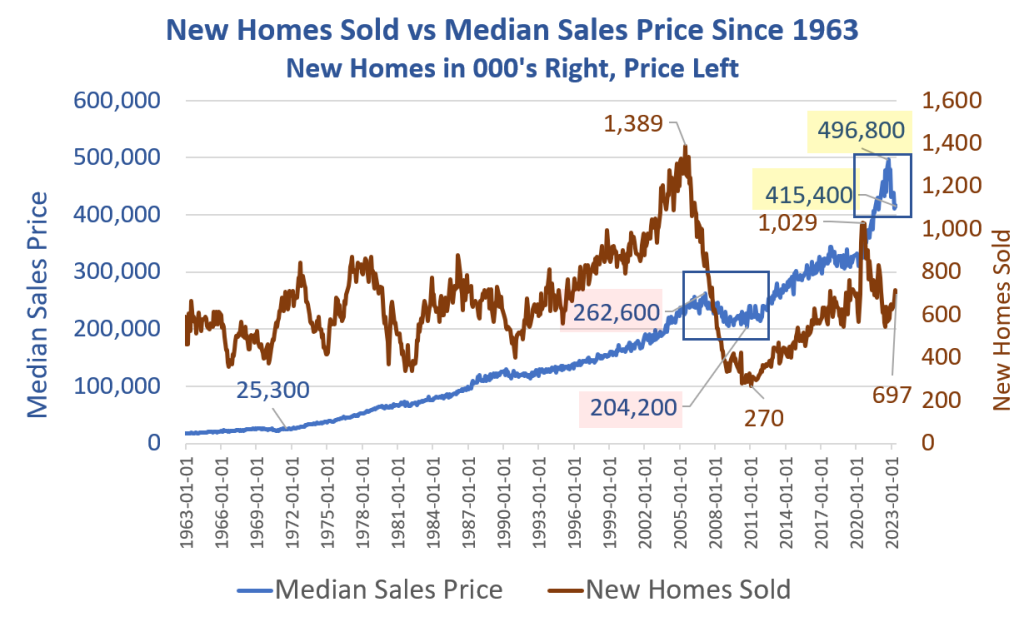
Median new home sales prices vs new home sales, data from the Census Department, chart by Mish
Existing homes sales prices remain stubbornly high as measured by Case-Shiller repeat sales of the same home.
In contrast, homebuilders have passed on lumber price discounts, offer interest rate buydowns, and now build smaller homes.
Buyers hit a brick wall on price with a peak of $496,800 in October of 2022. Median price has fallen 16.4 percent since then.
For discussion, please see How Much More Will Homebuilders Have to Reduce Prices to Increase Sales?
Mortgage Rates Are the Highest in 21 Years, What That Means in Pictures
On August 18 I noted Mortgage Rates Are the Highest in 21 Years, What That Means in Pictures
Case-Shiller Mortgage Rate Example

Mortgage News Daily calculation based on a Case-Shiller house that sold for $400,000 in February 2000 vs now.
On August 18 I noted Mortgage Rates Are the Highest in 21 Years, What That Means in Pictures
Today, I see mortgage rates jumped again. They are now 7.49 percent according to Mortgage News Daily, up from 7.37 percent on the 18th, in the image above.
Monthly payments are approaching triple from February of 2020. That does not include home insurance or taxes.
Good luck with that.
More By This Author:
Should the Fed Declare Defeat and Move On?
The Cost Of Soup Is About To Increase, Thank President Biden
Mortgage Rates Are the Highest in 21 Years, What That Means in Pictures


Comments
Log in or sign up to join the conversation.