EUR/USD Price Analysis: Mid-1.0700s Appear Tough Nut To Crack For Euro Bears
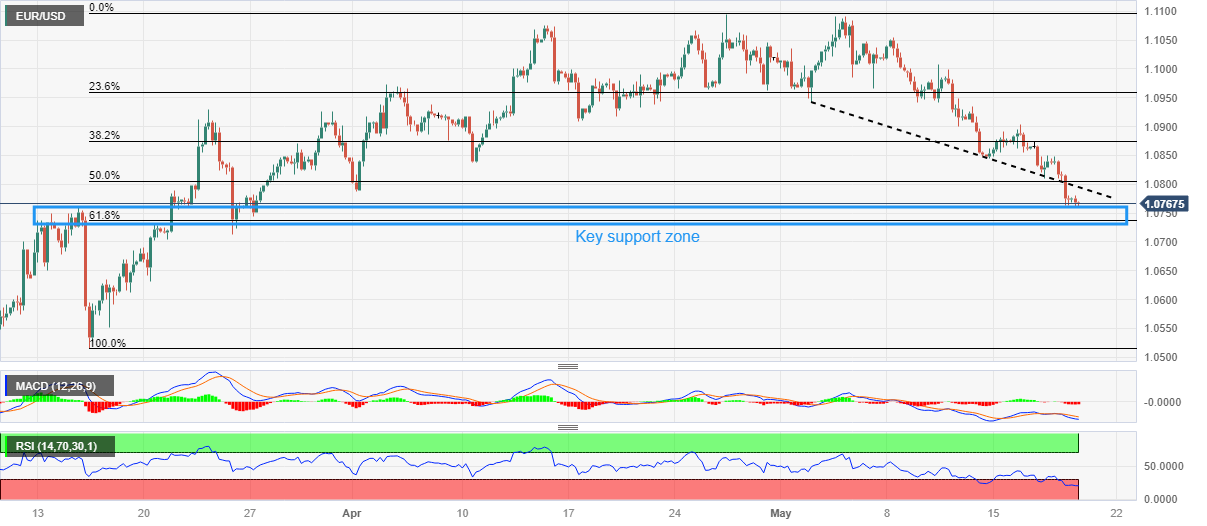
EUR/USD remains depressed at the lowest levels in two months, down for the fourth consecutive day, as Euro bears poke short-term key support surrounding 1.0750 heading into Friday’s European session.
Apart from the multiple supports marked since March 13, the oversold conditions of the RSI (14) line also challenge the Euro pair, not to forget the bullish sentiment surrounding the US Dollar.
It’s worth noting, however, that the bearish MACD signals and the previous support line from May 02, close to 1.0795 by the press time, quickly followed by the 1.0800 round figure, challenges the Euro’s corrective bounce, if any.
Also acting as an upside filter is the 50% Fibonacci retracement of March-May upside, near 1.0805, as well as the late April swing low of around 1.0910.
In a case where the EUR/USD remains firmer past 1.0910, the odds of witnessing a run-up toward the 1.1000 round figure and then to the monthly high near 1.1095 can’t be ruled out.
On the flip side, a daily closing beneath the aforementioned broad horizontal support zone of around 1.0760-30, will be detrimental for the EUR/USD pair price as it can make it vulnerable to testing the mid-March low surrounding 1.0515.
During the anticipated fall, the 1.0700 and 1.0600 round figures may check the Euro bears.
EUR/USD: Four-hour chart
(Click on image to enlarge)
Trend: Further downside expected.
ADDITIONAL IMPORTANT LEVELS
| OVERVIEW | |
|---|---|
| Today last price | 1.0764 |
| Today Daily Change | -0.0006 |
| Today Daily Change % | -0.06% |
| Today daily open | 1.077 |
| TRENDS | |
|---|---|
| Daily SMA20 | 1.0961 |
| Daily SMA50 | 1.0891 |
| Daily SMA100 | 1.0807 |
| Daily SMA200 | 1.0464 |
| LEVELS | |
|---|---|
| Previous Daily High | 1.0848 |
| Previous Daily Low | 1.0762 |
| Previous Weekly High | 1.1054 |
| Previous Weekly Low | 1.0848 |
| Previous Monthly High | 1.1095 |
| Previous Monthly Low | 1.0788 |
| Daily Fibonacci 38.2% | 1.0795 |
| Daily Fibonacci 61.8% | 1.0815 |
| Daily Pivot Point S1 | 1.0739 |
| Daily Pivot Point S2 | 1.0708 |
| Daily Pivot Point S3 | 1.0654 |
| Daily Pivot Point R1 | 1.0825 |
| Daily Pivot Point R2 | 1.0879 |
| Daily Pivot Point R3 | 1.091 |
More By This Author:
WTI Soars Over 3% On Growing Optimist Amidst US Debt Ceiling Talks And IEA Forecast
US: Housing Starts Rise 2.2% In April, Building Permits Decline 1.5%
USD/CAD Refreshes Daily Low Amid An Uptick In Oil Prices, Stronger USD To Limit Losses
Disclaimer: Information on these pages contains forward-looking statements that involve risks and uncertainties. Markets and instruments profiled on this page are for informational purposes only ...
more


