USD/CAD Refreshes Daily Low Amid An Uptick In Oil Prices, Stronger USD To Limit Losses

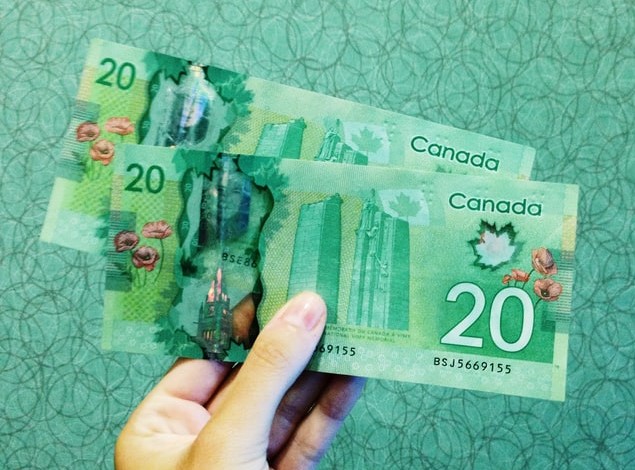
Photo by Michelle Spollen on Unsplash
- USD/CAD surrenders its modest intraday gains and drops to a fresh daily low in the last hour.
- A modest uptick in Oil prices underpins the Loonie and exerts downward pressure on the pair.
- Sustained USD buying might hold back bearish traders from placing fresh bets and limit losses.
The USD/CAD pair struggles to capitalize on its modest intraday gains and meets with a fresh supply near the 1.3535 region on Wednesday. Spot prices drop to a fresh daily low, around the 1.3470 region during the North American session, though the downside seems cushioned amid strong follow-through US Dollar (USD) buying.
In fact, the USD Index (DYX), which tracks the Greenback against a basket of currencies, sticks to its gains just below its highest level since March 27 touched today amid speculations that the Federal Reserve (Fed) will keep rates higher for longer. In fact, the recent hawkish comments by several FOMC members pushed back against market expectations for interest rate cuts later this year. This, in turn, continues to boost the buck and lends some support to the USD/CAD pair.
That said, the emergence of some buying around Crude Oil prices, along with hotter-than-expected Canadian consumer inflation figures released on Tuesday, underpin the commodity-linked Loonie. This, in turn, attracts some sellers around the USD/CAD pair and contributes to the intraday pullback of over 50 pips. Hence, it will be prudent to wait for strong follow-through buying and acceptance above the 100-day Simple Moving Average (SMA) before placing fresh bullish bets.
On the economic data front, the mixed US housing market data did little to provide any meaningful impetus to the USD/CAD pair.
The US Census Bureau reported that Housing Starts climbed 2.2% on a monthly basis in April as compared to the 1.9% rise anticipated and the 4.5% decline registered in the previous month. Building Permits, however, fell by 1.5% last month against consensus estimates pointing to a 3% increase and the 3% fall recorded in March.
Technical levels to watch
USD/CAD
| OVERVIEW | |
|---|---|
| Today last price | 1.348 |
| Today Daily Change | -0.0004 |
| Today Daily Change % | -0.03 |
| Today daily open | 1.3484 |
| TRENDS | |
|---|---|
| Daily SMA20 | 1.3512 |
| Daily SMA50 | 1.3561 |
| Daily SMA100 | 1.3512 |
| Daily SMA200 | 1.3467 |
| LEVELS | |
|---|---|
| Previous Daily High | 1.3494 |
| Previous Daily Low | 1.3404 |
| Previous Weekly High | 1.3565 |
| Previous Weekly Low | 1.3315 |
| Previous Monthly High | 1.3668 |
| Previous Monthly Low | 1.3301 |
| Daily Fibonacci 38.2% | 1.346 |
| Daily Fibonacci 61.8% | 1.3439 |
| Daily Pivot Point S1 | 1.3428 |
| Daily Pivot Point S2 | 1.3371 |
| Daily Pivot Point S3 | 1.3338 |
| Daily Pivot Point R1 | 1.3517 |
| Daily Pivot Point R2 | 1.355 |
| Daily Pivot Point R3 | 1.3607 |
More By This Author:
NZD/USD Sticks To Modest Intraday Gains, Remains Below 200 DMA Hurdle Near Mid-0.6200sSilver Price Analysis: XAG/USD Slumps To Six-Week Lows Amidst Higher US T-Bond Yields
Fed's Mester: I Don't Think We're At That Hold Rate Yet
Disclaimer: Information on these pages contains forward-looking statements that involve risks and uncertainties. Markets and instruments profiled on this page are for informational purposes only ...
more


