
EUR/JPY manages to grab some buying interest and leaves behind two consecutive daily drops on Wednesday.
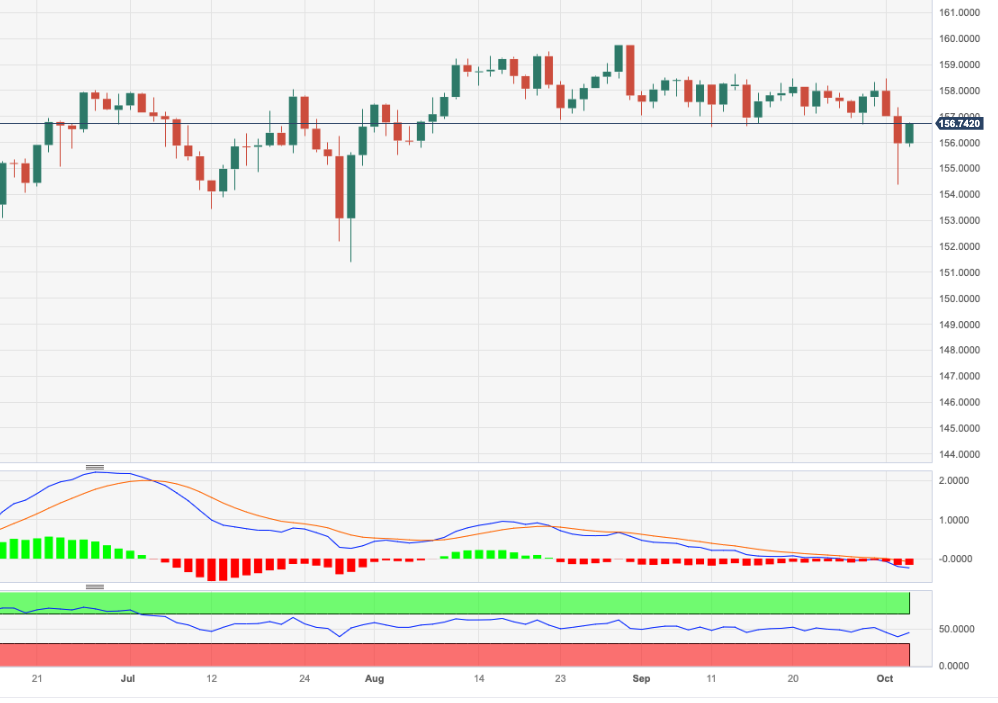
In the meantime, the cross remains stuck within the consolidative range and the breakout of it exposes a visit to the so far monthly high of 158.65 (September 13) prior to the 2023 top at 159.76 (August 30), which precedes the key round level at 160.00.
On the downside, the so far monthly low of 154.34 (October 3) emerges as the initial contention in case of bearish attempts.
So far, the longer term positive outlook for the cross appears favoured while above the 200-day SMA, today at 149.65.
EUR/JPY daily chart
EUR/JPY
| OVERVIEW | |
|---|---|
| Today last price | 156.69 |
| Today Daily Change | 94 |
| Today Daily Change % | 0.46 |
| Today daily open | 155.97 |
| TRENDS | |
|---|---|
| Daily SMA20 | 157.66 |
| Daily SMA50 | 157.65 |
| Daily SMA100 | 155.59 |
| Daily SMA200 | 149.62 |
| LEVELS | |
|---|---|
| Previous Daily High | 157.36 |
| Previous Daily Low | 154.39 |
| Previous Weekly High | 158.34 |
| Previous Weekly Low | 156.71 |
| Previous Monthly High | 158.66 |
| Previous Monthly Low | 156.58 |
| Daily Fibonacci 38.2% | 155.52 |
| Daily Fibonacci 61.8% | 156.22 |
| Daily Pivot Point S1 | 154.45 |
| Daily Pivot Point S2 | 152.94 |
| Daily Pivot Point S3 | 151.49 |
| Daily Pivot Point R1 | 157.42 |
| Daily Pivot Point R2 | 158.87 |
| Daily Pivot Point R3 | 160.39 |
More By This Author:
EUR/USD Price Analysis: Next On The Upside Comes 1.0617
USD Index Price Analysis: The Bullish Outlook Remains In Place
Crude Oil Futures: Further Recovery Looks Likely


Comments
Log in or sign up to join the conversation.