
- DXY comes under pressure following recent peaks.
- A move to 108.00 still appears in store near term.
DXY faces some selling pressure after climbing to new 2023 tops in the 107.30/35 band on Wednesday.
In light of the ongoing price action, extra gains appear likely in the dollar for the time being. Once the index clears the YTD high of 107.34 (October 3), it could encourage bulls to challenge the weekly peak at 107.99 (November 21, 2022) just ahead of the round level at 108.00.
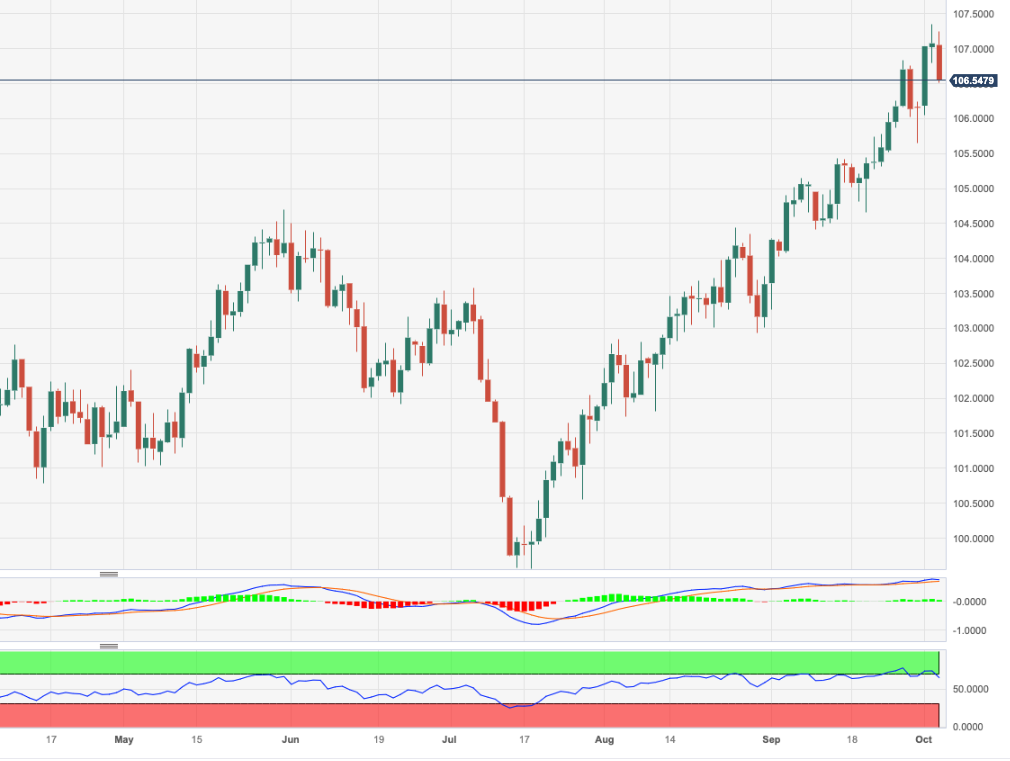
In the meantime, while above the key 200-day SMA, today at 103.13, the outlook for the index is expected to remain constructive.
DXY daily chart
(Click on image to enlarge)
Dollar Index Spot
| OVERVIEW | |
|---|---|
| Today last price | 106.57 |
| Today Daily Change | 74 |
| Today Daily Change % | -0.48 |
| Today daily open | 107.08 |
| TRENDS | |
|---|---|
| Daily SMA20 | 105.57 |
| Daily SMA50 | 104.05 |
| Daily SMA100 | 103.35 |
| Daily SMA200 | 103.13 |
| LEVELS | |
|---|---|
| Previous Daily High | 107.35 |
| Previous Daily Low | 106.8 |
| Previous Weekly High | 106.84 |
| Previous Weekly Low | 105.52 |
| Previous Monthly High | 106.84 |
| Previous Monthly Low | 103.27 |
| Daily Fibonacci 38.2% | 107.14 |
| Daily Fibonacci 61.8% | 107.01 |
| Daily Pivot Point S1 | 106.8 |
| Daily Pivot Point S2 | 106.53 |
| Daily Pivot Point S3 | 106.25 |
| Daily Pivot Point R1 | 107.35 |
| Daily Pivot Point R2 | 107.62 |
| Daily Pivot Point R3 | 107.9 |
More By This Author:
Crude Oil Futures: Further Recovery Looks LikelyUSD Index Price Analysis: Next On The Upside Comes 108.00
Natural Gas Futures: Further Losses In Store Near Term


Comments
Log in or sign up to join the conversation.