
Last Thursday’s CPI report lit a fire under US stocks. It was as if the FOMO phenomenon was in play in a seasonally strong period. But it is early to adopt a full risk-on mode. By Friday, the S&P 500 stood 2.7 percent from major resistance, the Nasdaq was essentially at resistance and the Russell 2000 was rejected at one.
October’s CPI report caused investors to rejigger asset allocation last Thursday. The 10-year treasury yield in that session tumbled 32 basis points to 3.83 percent, the US dollar index dropped 2.1 percent to lose 109, and the S&P 500 surged 5.5 percent past 3900.
Equity investors have been craving for a Fed pivot for a while, hoping the central bank ends the rate-tightening cycle and goes the other way. This is not likely to happen anytime soon. But a step-down from the current pace is possible.
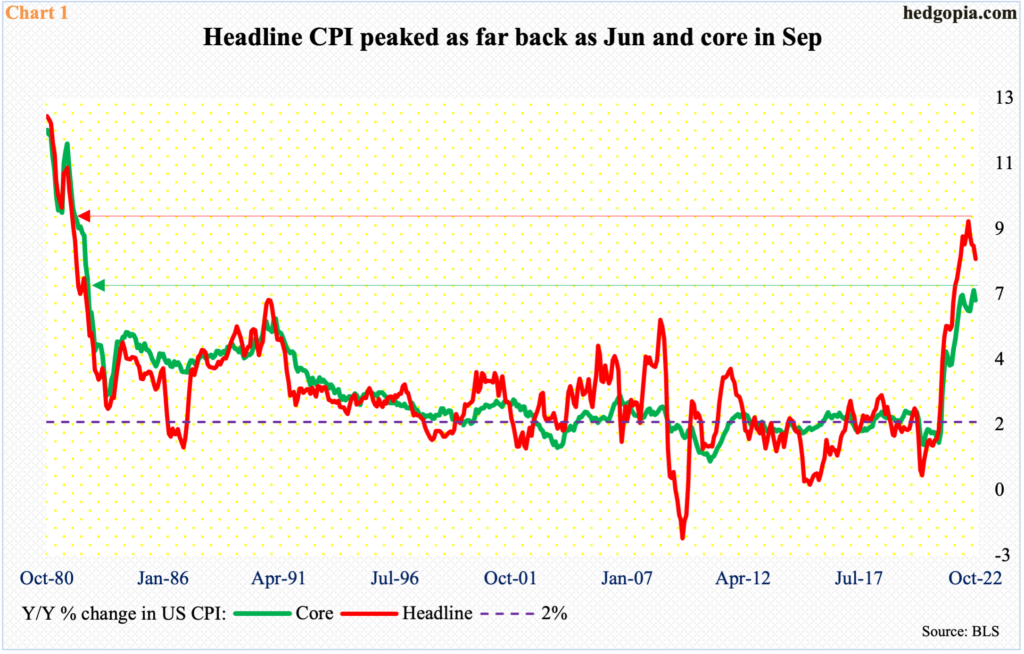
Last month, headline and core consumer prices decelerated to a year-over-year growth of 7.7 percent and 6.3 percent respectively. Headline inflation peaked as far back as June at 9.1 percent, which was the highest since November 1981; core, on the other hand, jumped 6.6 percent in September, which was the steepest pace since August 1982 (Chart 1).
In the futures market, ahead of the CPI, traders were split right down the middle between a 75 and a 50 in next month’s FOMC meeting; post-CPI, a 50 is looking like a lock. Currently, the fed funds rate stands at a range of 375 basis points to 400 basis points and is expected to crest near five percent by next May.
That said, nothing is set in stone. The next FOMC meeting is on December 13-14, with November’s CPI due out on the 13th. Plus, October’s PCE price index will be published on December 1. One hot report can quickly swing the rate odds the other way.
For now, investor reaction has been nothing short of spectacular. On Thursday, the majority clearly voted that inflation has peaked and the Fed will reciprocate with less aggression in the months ahead.
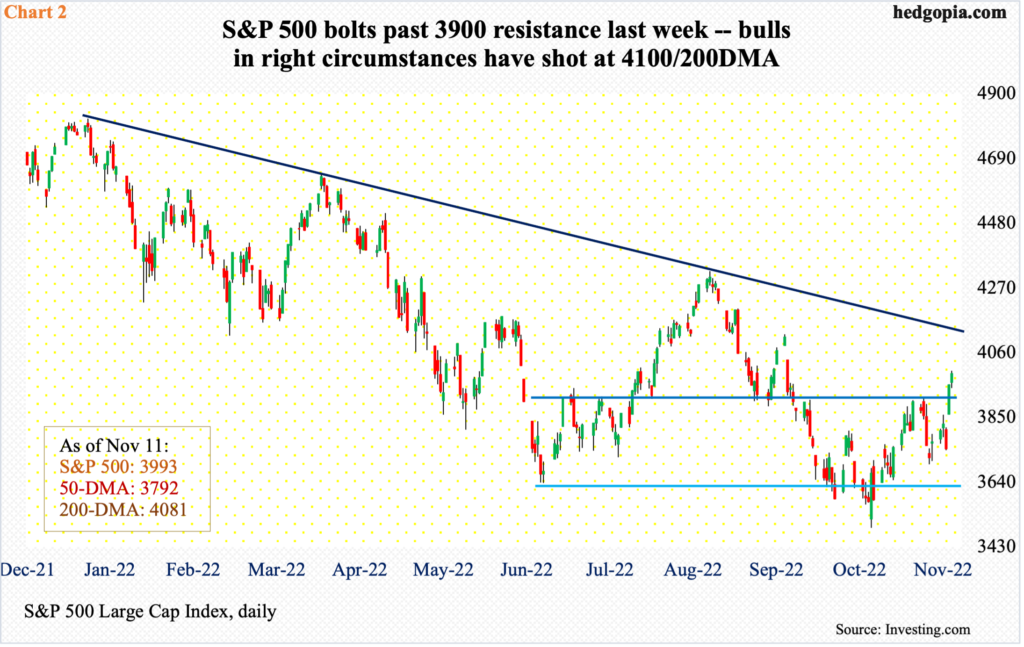
Last week, the S&P 500 jumped 5.9 percent, with the large cap index rallying 6.5 percent in the last two sessions. Prior to this, the index remained under 3900 for eight weeks and the level was reclaimed in Thursday’s gap-up session, closing the week out at 3993.
Around 4100 lies trend-line resistance from January when the S&P 500 peaked at record 4819 (Chart 2). Right there also lies the 200-day moving average at 4081. Until this dual resistance gets decisively taken out, this remains a bear-market rally.
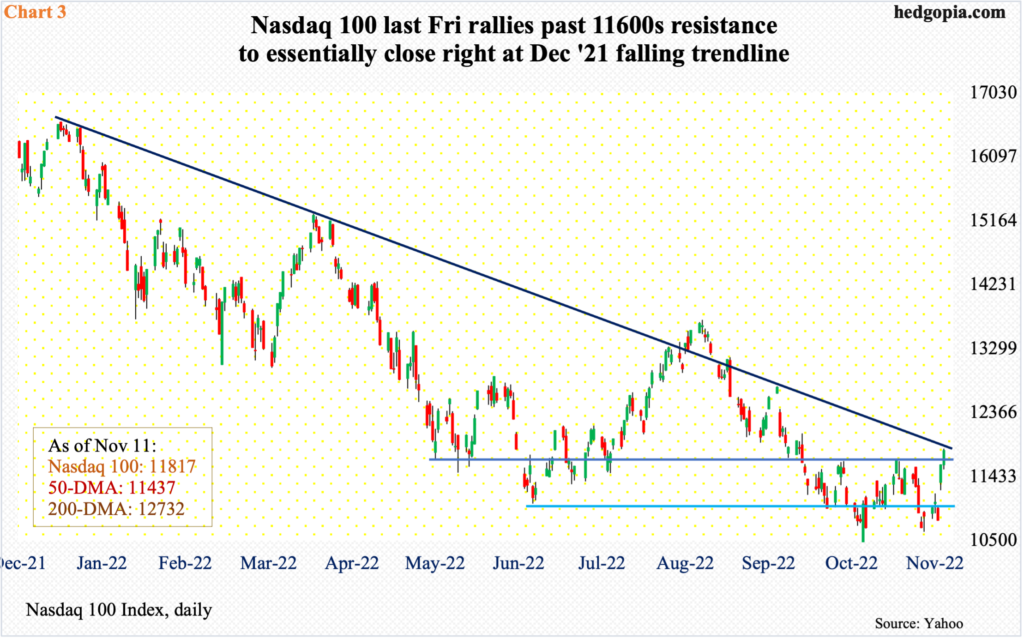
The Nasdaq 100 similarly surged 8.8 percent last week, with Thursday and Friday accounting for 9.4 percent. The tech-heavy index (11817) has been on either side of 11600s for six months now, and this level was recaptured on Friday, ending the week just under a falling trend line from last December (Chart 3).
The Nasdaq 100 peaked last November at 16765.
Noticeably, small-caps – traditionally known as a risk-on barometer – lagged big time last week. The Russell 2000 only rallied 4.6 percent.
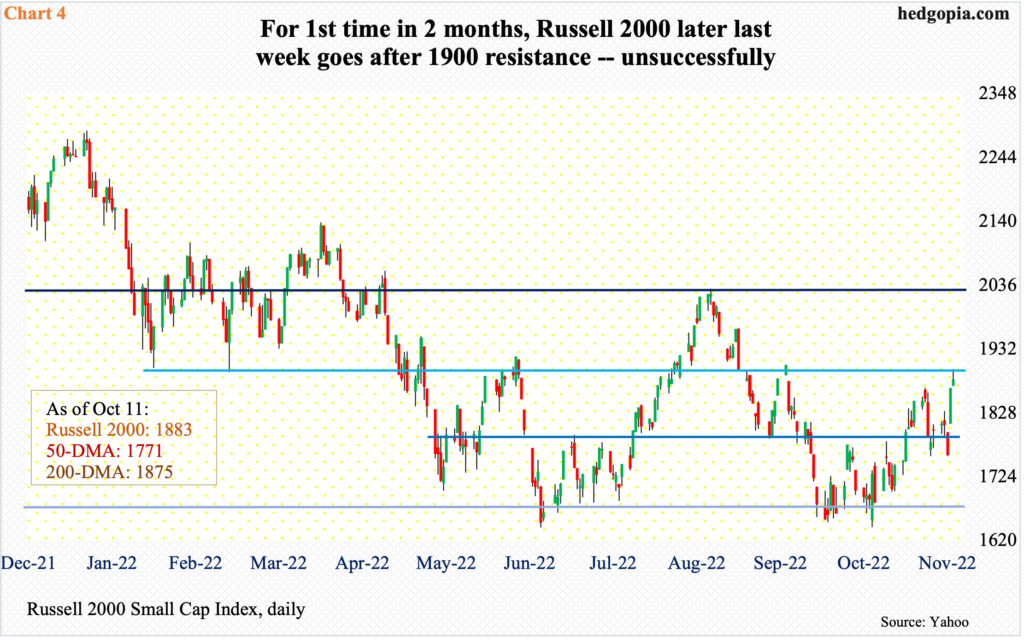
The index peaked last November at 2459, before dropping all the way to 1642 a month ago. In between, it has gone back and forth between several ranges.
A major breakdown occurred mid-January, losing 2080s; for 10 months before that, the Russell 2000 went back and forth between 2080s and 2350s. It then seesawed between 2080s and 1900, followed by a ping pong match between 1900 and 1700; 1700 is where it broke out of in November 2020.
Last Friday, for the first time in a couple of months, the small cap index went after 1900, and was rejected in a shooting star session (Chart 4). This action is potentially important.
One reason behind the post-CPI investor reaction is FOMO (the fear of missing out) in action. November is halfway through, and the weeks ahead tend to be seasonally strong. For this to pan out, a new set of buyers needs to show up. The technically-oriented ones in particular are closely watching the resistance mentioned above on all three indices.
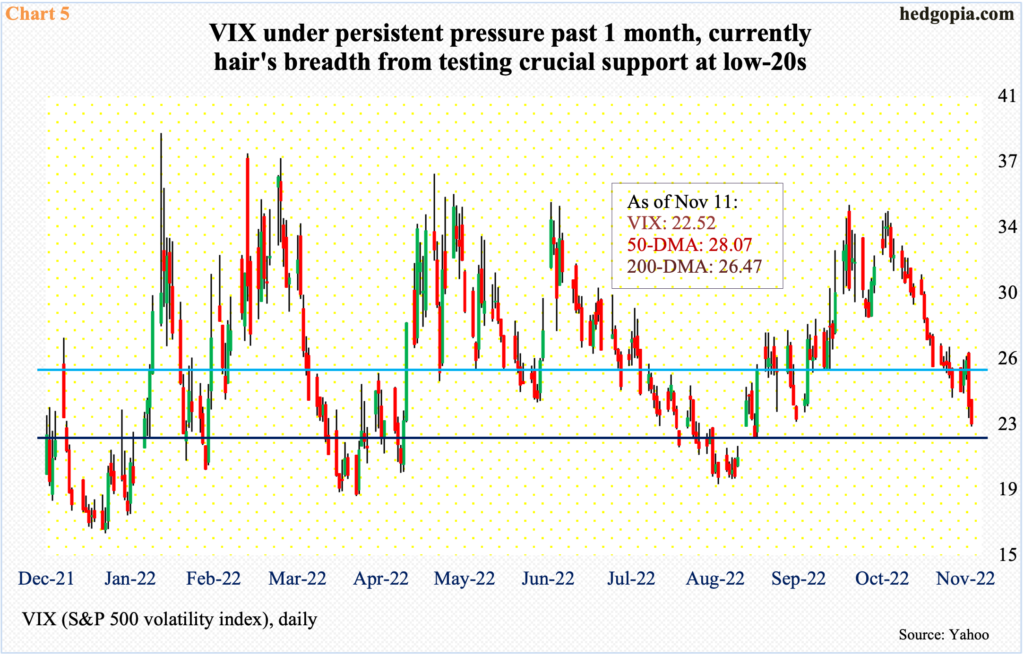
Concurrently, VIX is approaching crucial support. The volatility index has come under intense pressure over the past month, as it reversed lower after tagging 34.53 on October 12. Last Friday, it ticked 22.37, ending the week at 22.52. Horizontal support at low-20s goes back years, not just months or quarters (Chart 5).
Then there is this.
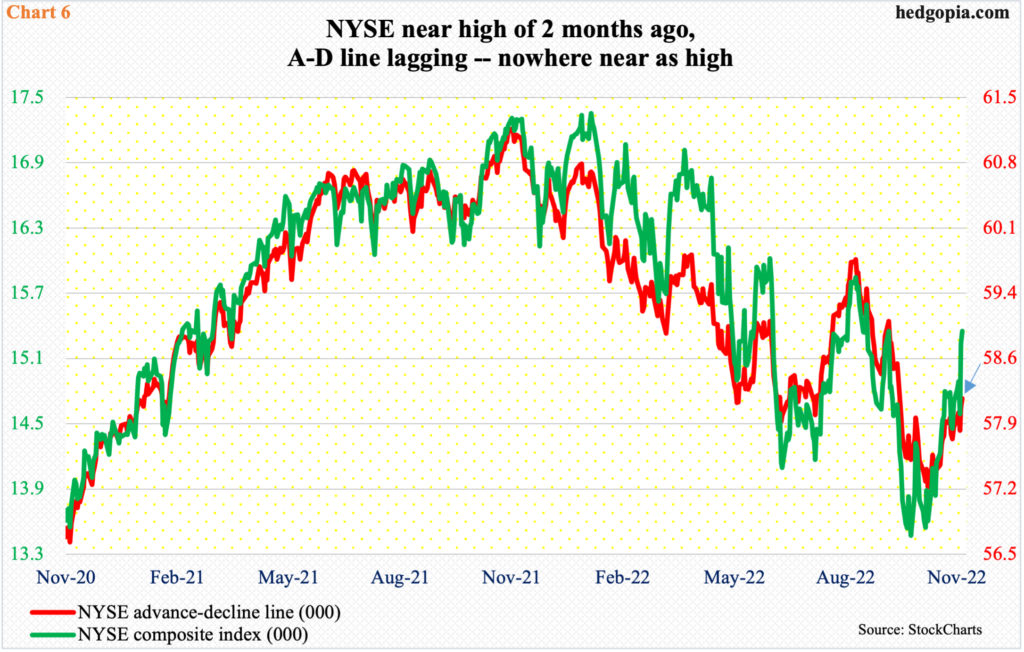
First of all, in a market like this, it is easy to find indicators to suit one’s bias. One just has to look around. There will be diverging metrics. With that out of the way, the advance-decline line is not confirming last week’s massive rally in most equity indices.
Chart 6 pits the NYSE composite index against its A-D line, and the latter is lagging. The index closed Friday at 15353, a level it last reached two months ago. The A-D line, however, is nowhere near as high (blue arrow). In a healthy market, breadth needs to support the price action. This is currently missing.
Thanks for reading!
More By This Author:
CoT: Peek Into Future Thru Futures; How Hedge Funds Are Positioned - Sunday, Nov. 6Pivot Party Pooped: At Some Point, Selling Needs To Be Faded In Seasonally Strong Period
CoT: Peek Into Future Through Futures, How Hedge Funds Are Positioned - Monday, Oct. 31


Comments
Log in or sign up to join the conversation.