Emerging Markets ETF Makes Strides
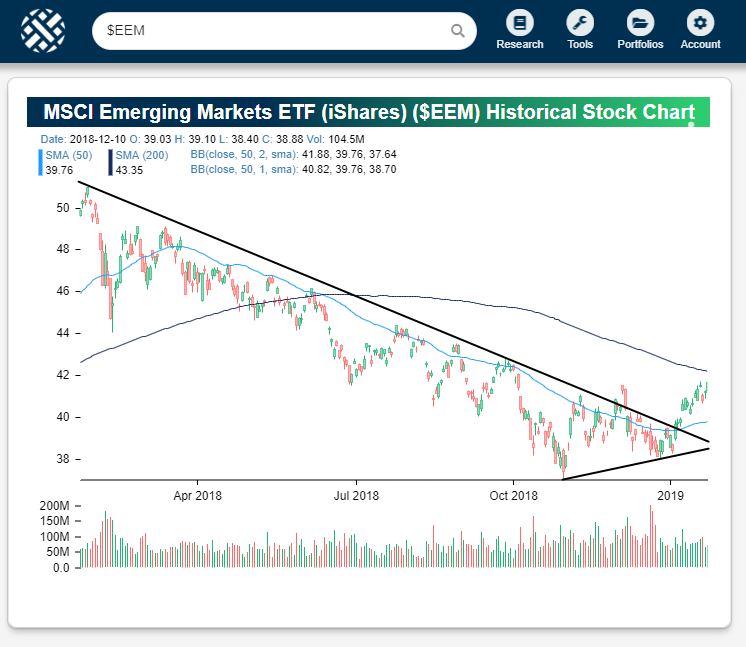
The Emerging Markets ETF (EEM ) continues to trend higher in 2019 after a horrible 2018 in which it trended lower for basically the entire year. Below is a snapshot of EEM’s chart over the last year. As you can see, every time EEM got near or just above resistance at its 50-day moving average in 2018, it was stopped dead in its tracks. So far this year, the ETF has managed to break and hold solidly above resistance at its 50-day, and in the process, it has broken out of the long-term downtrend channel that was in place. Also, the ETF experienced its first “higher low” at the turn of the year, and this week it has made a “higher high” by trading above prior highs seen in December.
After a very rough stretch of bearish trading, there appears to be light at the end of the tunnel for EEM bulls.
(Click on image to enlarge)

Disclaimer: To begin receiving both our technical and fundamental analysis of the natural gas market on a daily basis, and view our various models breaking down weather by natural gas demand ...
more


