Elliott Wave Technical Analysis: Intuit, Wednesday, Aug. 2
Intuit Inc., Elliott Wave Technical Analysis

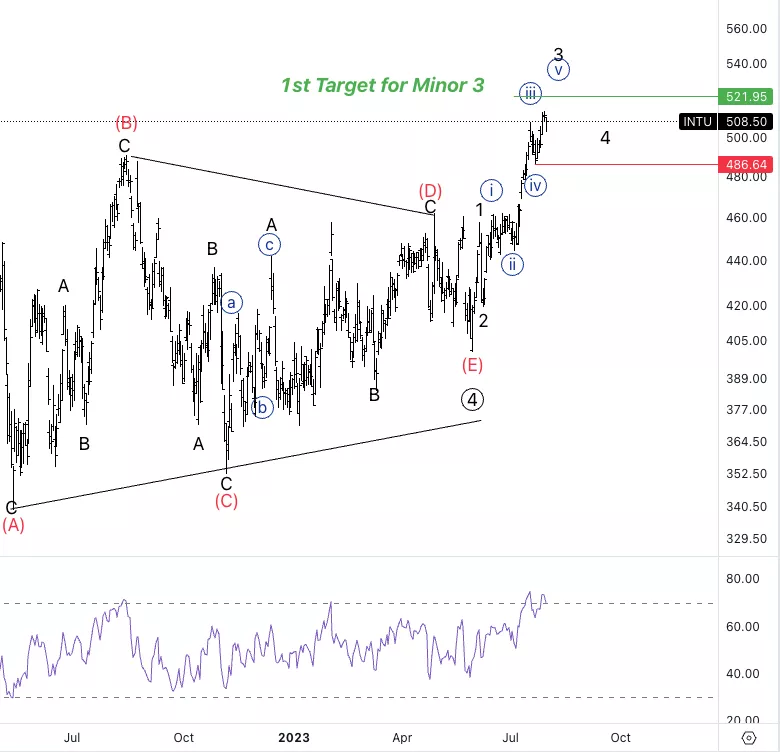
Intuit Inc., (INTU:NASDAQ): Daily Chart, Wednesday August 2.
INTU Stock Market Analysis: We have been looking for upside into wave 3 after we broke the triangle in primary wave 3. We are very close to the Minor wave 3 target at 521$. RSI is starting to suggest a slight loss in upside momentum which could signify we could be near a temporary top.
INTU Elliott Wave Count: Wave {v} of 3.
INTU Technical Indicators: Above all averages.
INTU Trading Strategy: Looking for upside into wave 3.
TradingLounge Analyst: Alessio Barretta

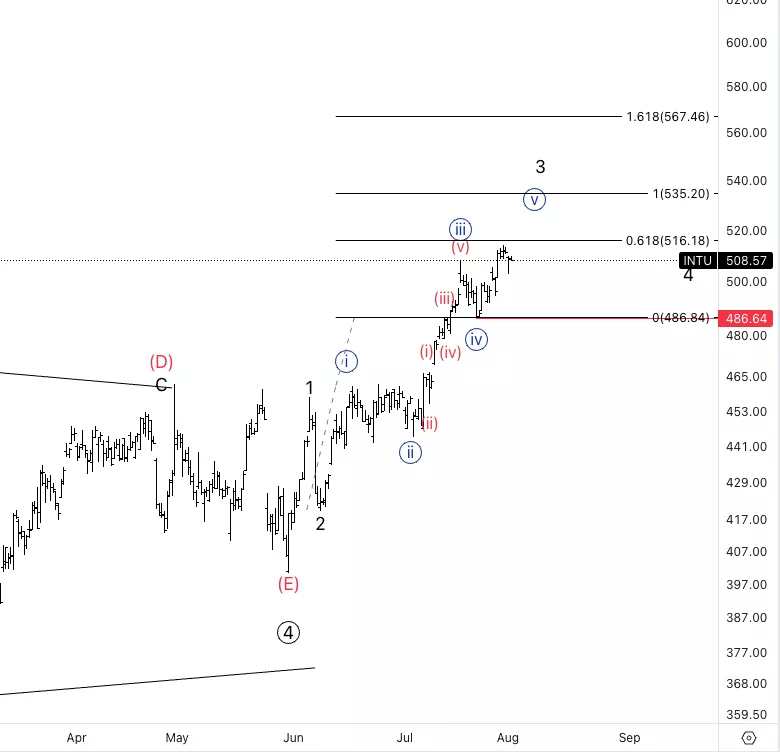
Intuit Inc., INTU: 4-hour Chart, Wednesday, August 2.
Intuit Inc.,Elliott Wave Technical Analysis
INTU Stock Market Analysis: Wave {v} does not seem complete as we do not have a clear five wave move into wave {v}. Invalidation stands at 486$.
INTU Elliott Wave count: Wave {v} of 3
INTU Technical Indicators: Above all averages.
INTU Trading Strategy: Looking for longs into wave {v}.

More By This Author:
Elliott Wave Technical Analysis: Australian Dollar, Wednesday, Aug. 2
4 Hour Chart Elliott Wave Technical Analysis: Australian Dollar / Japanese Yen - Tuesday, August 1
Elliott Wave Technical Analysis: Bitcoin/U.S. Dollar - Tuesday August 1
Analyst Peter Mathers TradingLounge™ Australian Financial Services License - AFSL 317817


