

Image Source: Pexels
The recent spate of economic data continues to point to a weakening economy but one that is not yet precipitously falling into recession. The Philly Fed Index was released late last week. The diffusion index for current general activity declined 11 points to 4.5 in May. The index for new orders declined from 12.2 to -7.9, its first negative reading since February, and the shipments index fell from 19.1 to -1.2, its first negative reading since January. We also had US industrial production data released this week. It was flat in April from the previous month, while factory output fell by 0.3%.
The Conference Board Leading Economic Index for the U.S. decreased by 0.6 percent in April 2024 to 101.8, after decreasing by 0.3 percent in March. This is what the board had to say about its latest reading:
“Another decline in the U.S. LEI confirms that softer economic conditions lay ahead. Deterioration in consumers’ outlook on business conditions, weaker new orders, a negative yield spread, and a drop in new building permits fueled April’s decline. In addition, stock prices contributed negatively for the first time since October of last year. While the LEI’s six-month and annual growth rates no longer signal a forthcoming recession, they still point to serious headwinds to growth ahead. Indeed, elevated inflation, high interest rates, rising household debt, and depleted pandemic savings are all expected to continue weighing on the US economy in 2024. As a result, we project that real GDP growth will slow to under 1 percent over the Q2 to Q3 2024 period.”
Market-based data is also shouting a warning. The yield curve has been inverted since July of 2022. The 10-year minus 2-year Note Treasury yield curve spread is now experiencing its longest inversion in history. This indicator has been a near-perfect recession predictor since 1955. The one exception occurred back in 1965. There was no recession then, but GDP growth absolutely plummeted from 10% growth to 0.2%, and the market fell by 20%. So yes, that really doesn’t count as an exception.
If you want to ignore the Index of leading Economic Indicators, the net percentage of banks that are tightening lending standards, the decrease in the fed’s balance sheet, shrinking M2 money supply, negative ISM surveys, and the inverted yield curve, you may do so at your peril. They all point to a weakening economy. However, we need to see credit spreads to widen and financial conditions tighten before we believe a recession and bear market are imminent. And that just is not happening currently. Nevertheless, the clock is ticking towards recession and another crisis in credit, as the humongous debt load cycles at much higher interest rates.
This is because inflation has already eviscerated the middle class. 78% of consumers are living paycheck to paycheck, meaning they spend all their income on the necessities of living and have nothing left over to save. 80% of consumers have less than 5k in savings, 50% have $500 or less in the bank, and 36% have more credit card debt than savings. The average consumer owes $6,218 on their credit cards, up 8.5% year over year, according to TransUnion. If you need more proof that the consumer is hanging on by a thread, Target (TGT) posted earnings on Wednesday. This major retailer said year-over-year sales declined by 3%–tough to do with official inflation rising at 3.5%–and it also missed Wall Street’s earnings estimates, as the company highlighted a consumer that is fatigued from high prices and therefore purchased both fewer discretionary items and groceries. TGT shares fell by 8%.
The salient issue here is that an unprecedented surge of inflation occurred over the past four years. Therefore, prices need to fall, not just go up more slowly, to heal the consumer and the economy. You cannot have a healthy economy without a healthy middle class. This is because it is the middle class that actually does most of the work and produces the vast majority of the goods and services in the economy. The poor collect from the government and the wealthiest among us tend to live off passive income from dividends and interest.
Let’s talk about gold vs. stocks. While the 30 stocks within the Dow Jones Industrial average hit an all-time high of 40k this week, the broader average of the Russell 2000 is down 15% from its high hit in late 2021. The market remains bifurcated just as the trenchant wealth gap of consumers continues to widen. A middle class that has been hollowed out by inflation leads to an unhealthy market, which is best illustrated by looking at the returns of gold vs. the S&P 500.
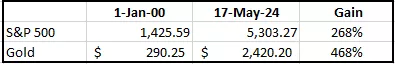
As Jay Taylor puts it, during the years since 2000, the S&P 500 had eight losing years with an average loss of 13.46%. Gold lost value against the dollar in 7 years, but the average loss was just 7.31%. Wining years for the S&P averaged 16.78% and 16.45% for gold. So, in measuring risk in terms of volatility, the S&P as a whole was more risky than gold. How often does the Main Stream Financial Media talk about that? They do not because what they really are is an infomercial for Wall Street.
Buying and holding a 60/40 portfolio is dodo-bird investing. Correctly identifying the second derivative of inflation and what asset classes, style factors, and sectors to own in each macroeconomic condition is the key to investment success.
More By This Author:
Bananas Grow In WashingtonJanuary Recap And A Heads Up For March
2024 Outlook


Comments
Log in or sign up to join the conversation.