

Image Source: Pixabay
Through Jan. 31, 2025, in anticipation of tariffs that might or might not be announced today:
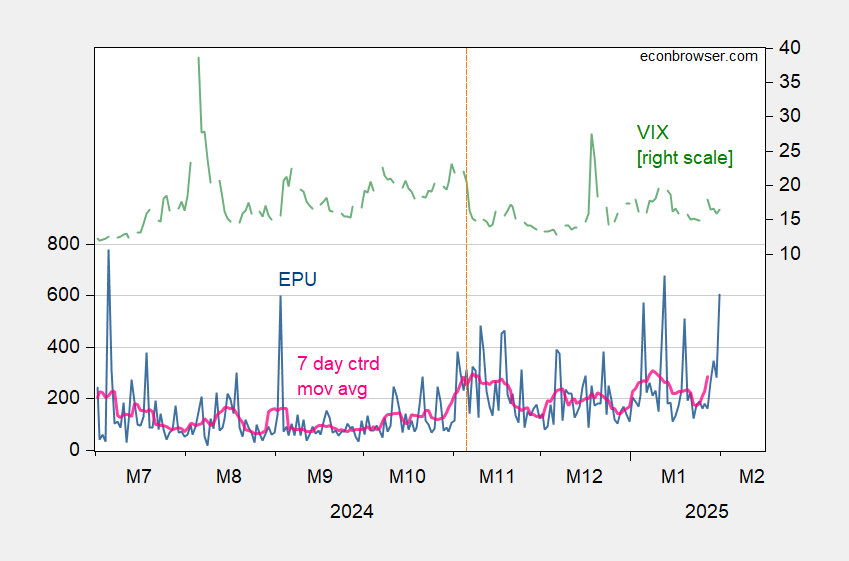
(Click on image to enlarge)
Figure 1: EPU (blue, left scale), 7 day centered moving average (red, left axis), and VIX close (green, right scale). Source: policyuncertainty.com and CBOE via FRED, and author’s calculations.
More By This Author:
Do You Feel Lucky? Trump Tariffs In View
Business Cycle Indicators – Where’s That Recession?
Bessent’s 3-3-3 “Plan” In The Context Of 2024Q4 Advance GDP Release


Comments
Log in or sign up to join the conversation.