Earnings And Valuations Update; Still Nowhere Near Good
At the end of July with a majority of the 500 companies included in the S&P 500 Index (SPY) having reported their earnings, the tabulated EPS (as reported) was figured around $24.09. That was already down sharply from just a month earlier when compared to analysts’ expectations from just before Q2 earnings season started. In late June, the EPS outlook suggested $26.38, meaning that companies truly disappointed from even the lowered expectations that were offered after the quarter was almost concluded.
With now nearly all companies having submitted their numbers, Q2 EPS dropped yet again to just $23.28. Estimates at the start of the quarter (Q2) in April 2016 were shooting for $26.69 and a 17% growth rate as compared to the disaster of Q2 2015. Instead, index EPS has been chopped by 16%, losing $3.41 during and after the quarter itself. What was supposed to be the return of growth is revealed as the same rut; year-over-year quarterly EPS is but 2% above last year’s low level.
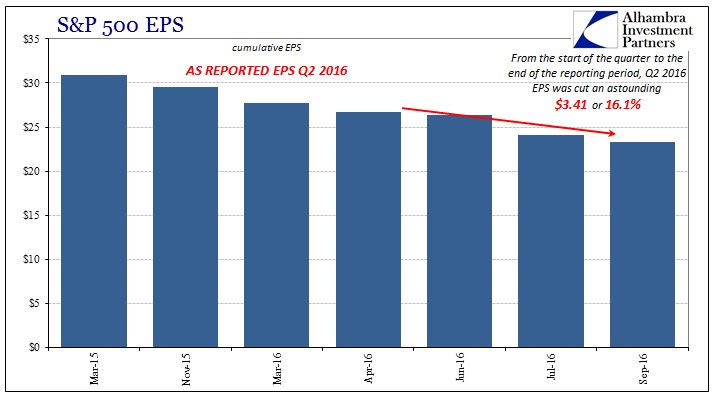
It very much matches and confirms the disappointment across the economy including and especially the lack of bounce in GDP. In other words, once again whether economy or just earnings, there was no detectible start toward recovery leaving it all once again a matter of pure, unbacked mainstream rhetoric. We keep hearing that it is coming only to find out that it hasn’t. In terms of EPS, trailing-twelve-month earnings show that as the literal truth. Four quarter earnings with the updated disappointment for Q2 add up to just $87.73. That is the third straight quarter around $86 or $87, the fifth straight below $95. Earnings have not changed in a long time even though this was supposed to be “transitory” weakness.
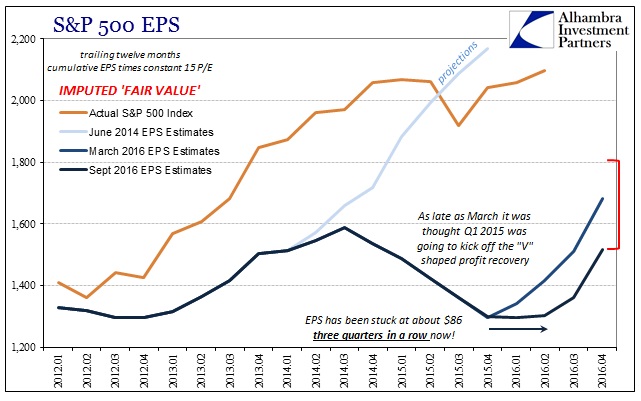
This is a stark change from as late as March where analysts were expecting the “V” shaped recovery to start in Q1 and then accelerate sharply into Q2 and beyond. It just never happened, further calling into question the usual expectations that acceleration will show up eventually only now pushed out even more into the future.
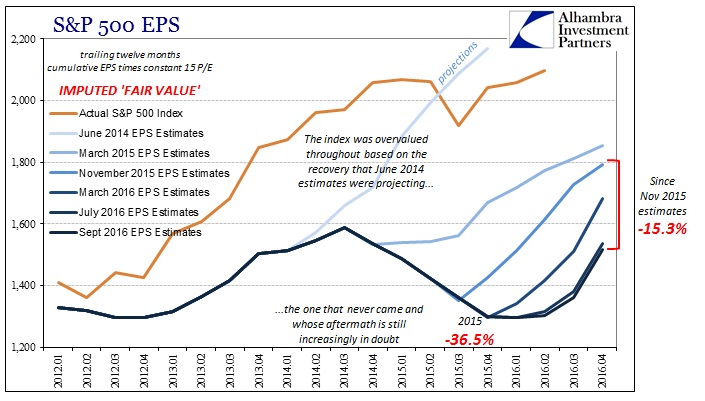
As of this latest update, Q3 EPS (ttm) is expected to amount to only $90.65, which would mean a full year with earnings stuck at the bottom. Given this trend of seeing recovery where none exists, we have every reason to suspect that $90.65 is the best case. It may very well turn out that there could yet be a new low for earnings.
This is a major problem for stock investors because the longer it takes for EPS to grow again the more likely the “market” will realize this and other valuation disparities. By practically any technique you employ, the current condition in stocks is comparable only to the dot-com era.
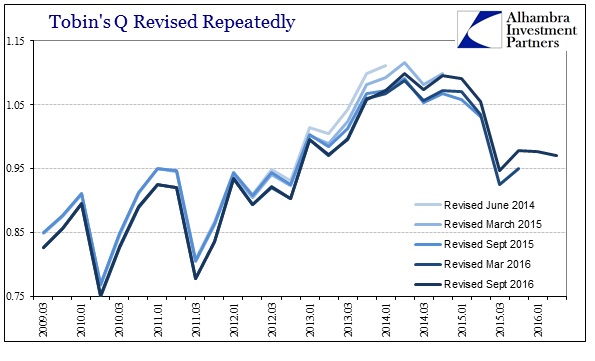
With the latest data from the Financial Accounts of the United States (formerly Flow of Funds; still Z1) through Q2, we can update alternate valuations methods such as Tobin’s Q. The Q ratio takes the estimated net worth of all non-financial corporate businesses as the standard for valuation. Thus, even if stock prices rise precipitously, if net worth does in similar proportion the Q ratio will show a fundamental reason backing any such “bull” move.
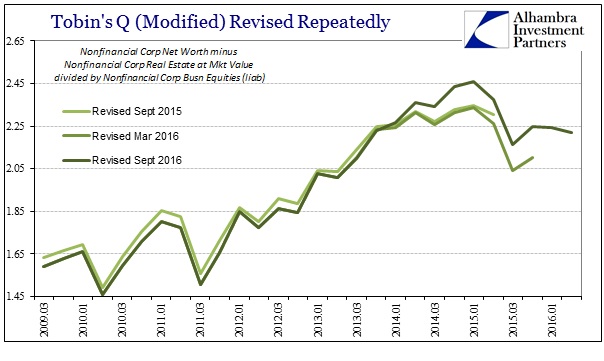
There are some problems with this approach, namely that corporate net worth includes the market value of real estate on company balance sheets. In cases where real estate itself might be out of fundamental alignment, the Q ratio would use one bubble in real estate to justify perhaps another in stocks. For my own purposes, I use a modified Q ratio which simply subtracts the real estate component from net worth. Neither is perfect and both are instructive.
In the latest Z1 update, however, factoring real estate makes a big difference. Overall corporate net worth was revised significantly lower, while the revisions to estimated values of corporate equities were not much changed. For Q4 2015, for example, the March estimates of net worth showed $22.8 trillion, now revised to $22.2 trillion. Corporate equities were practically unchanged at $21.681 trillion, leaving the Q ratio to project higher; .978 compared to .951.
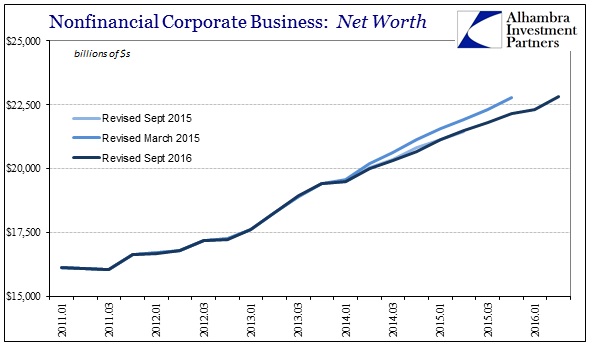
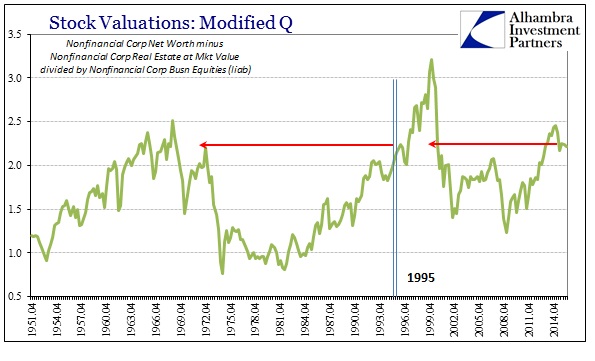
The estimated market value of real estate, however, was actually revised a little upward. Thus, the downward revision in net worth not including real estate was much more severe. The change in the modified Q ratio for Q4 2015 is therefore much larger, going from 2.10 to now 2.25.
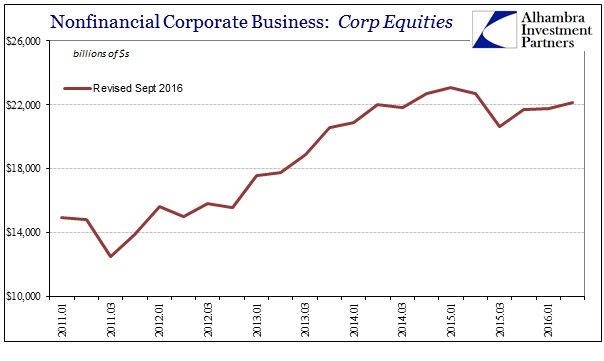
As you can see above, this retroactive change makes stock valuations appear even more out of alignment throughout the last few years where earnings have dropped and failed to recover. It should also be noted that according to the Z1 figures, the overall value of corporate equities peaked in Q1 2015 and remain still below that level; even though the S&P 500 and other indices have registered new highs since then.
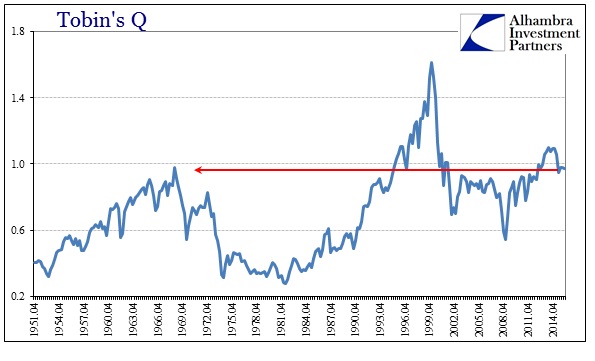
By historical comparison, both methods of the Q ratio remain quite elevated. For Tobin’s Q, it means stock valuations that are comparable to around 1995 as well as the prior bull market peak in the late 1960’s. The modified Q, however, with real estate values making up an increasing part of the growth in corporate net worth these past few years, valuations remain comparable to around 1997 heading into the true mania years of that era.
It is a very precarious position for equities overall; earnings that just won’t grow, reflecting an economy itself stuck in a similar state, imbalanced against a position where overall prices are historically high. It seems as though so long as “investors” continue to buy the rebound story, none of this matters – at least until “dollar” conditions force another temporary reconciliation. More problematic, however, is what might happen should the rebound idea itself (the faith in central bankers) start to fade as much as EPS. As the Z1 estimates show, the perhaps widest view of stocks figures them down more than a year later and still there is little fundamental support either from earnings or in historical comparison.
Disclosure: This material has been distributed for ...
more


Thanks for sharing