
DOW JONES Stuck In A Triangle Corrective Pattern
Today we will talk about stocks, specifically Dow Jones Industrial. As you already know, stocks are in an impulsive rally since the beginning of 2019 and it seems like there will be no deeper decline, at least not yet.
Looking at the higher time frame chart of Dow Jones, we still see an unfinished five-wave cycle, so there's room for more upside towards 26500 – 27500 area for wave V once a corrective wave »IV« fully unfolds, which more and more looks like a triangle.
DOW JONES DAILY
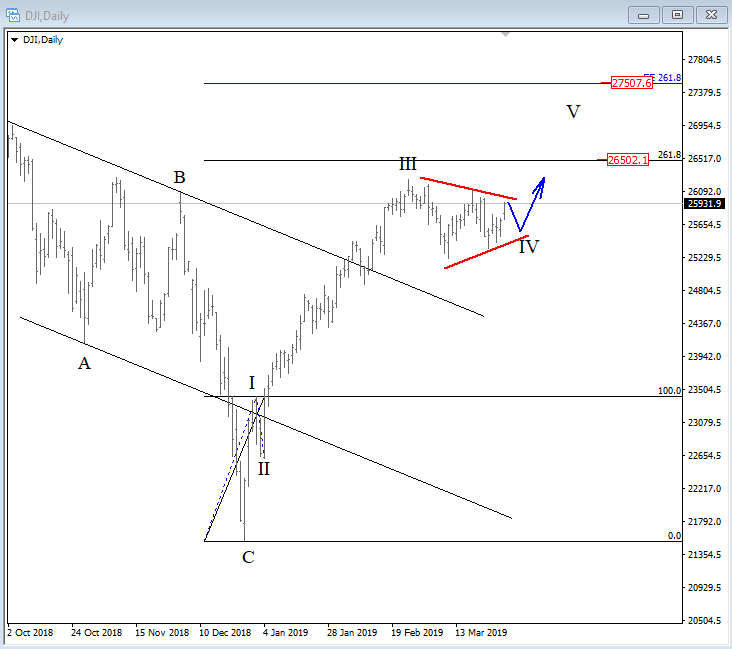
Triangles consist of five waves A-B-C-D-E, where each wave has three legs A-B-C. So, if we take a look on the smaller time frame chart into a triangle pattern, we can clearly see how nicely it's unfolding mentioned triangle. But, as you can see, wave E is still missing, so before a completion of a triangle and a bullish continuation, we may see another drop.
DOW JONES HOURLY
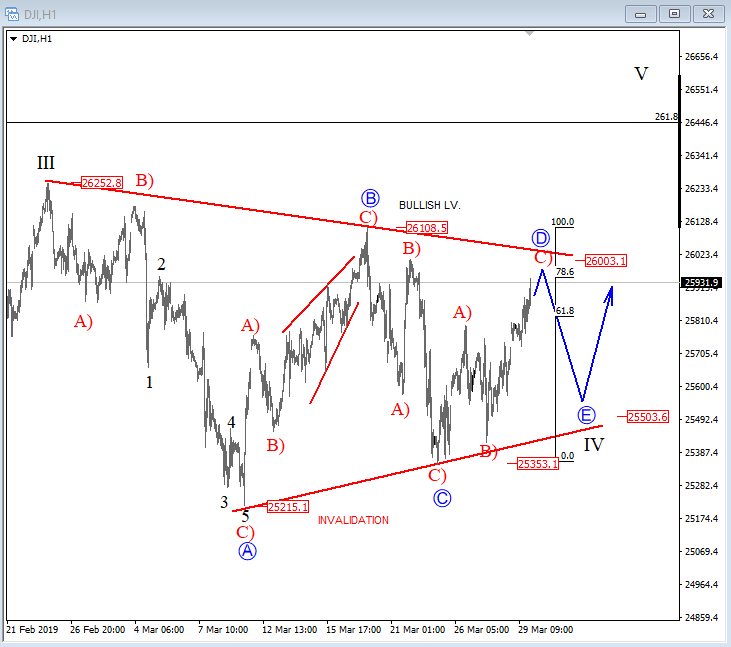
Technically speaking, the Dow Jones is currently approaching important resistance for wave D, here at the upper line of a triangle around 26000 area, from where we may see another fall for the final wave E back to the lower side of a triangle range, where ideal support would be around 25500 area.
But, keep in kind that waves E can be even shorter or more complex, so a projected bullish triangle can be confirmed only above 26100 region, while price is trading above 25215 invalidation area.


Don't you mean a triangle consolidation pattern? After the consolidation it may run up as a summer rally may occur. Then who knows what will happen.
yes, this is what we think.. more gains. summer can be interesting ;)