Does A Downturn In Household Survey Employment Presage A Recession?
I sometimes see this assertion. It clearly has relevance given the pattern we have as of June 2022 data. The red arrows indicate local maxima.
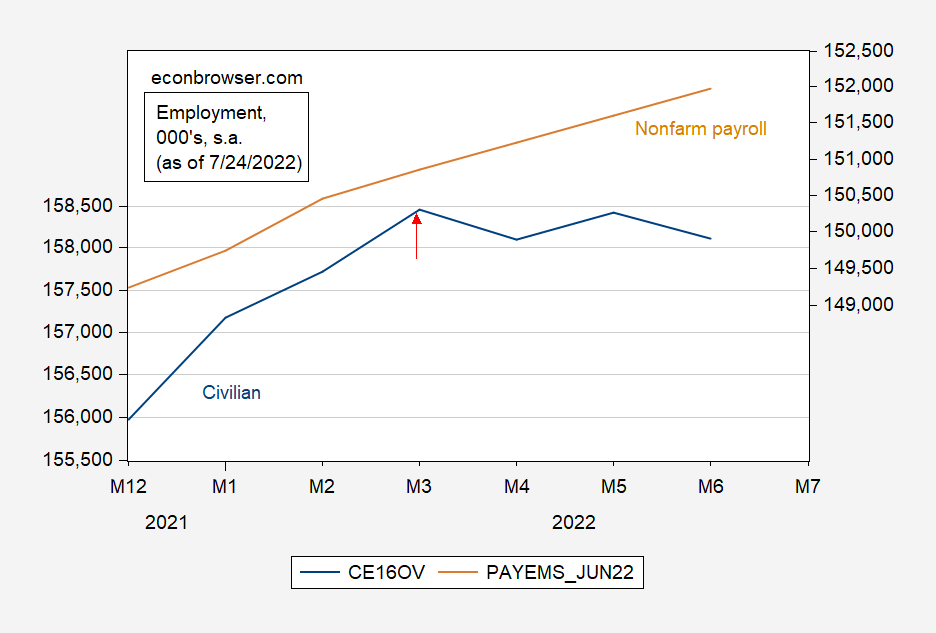
Figure 1: Civilian employment over age 16 (blue, left log scale), nonfarm payroll employment (tan, right log scale), both in 1000’s, seasonally adjusted, both as of 7/24/2022. Source: BLS via FRED.
Looking at the last four recessions, we see the following patterns:

Figure 2: Civilian employment over age 16 (blue, left log scale), nonfarm payroll employment (tan, right log scale), both in 1000’s, seasonally adjusted, both as of 7/24/2022. NBER defined peak-to-trough recession dates shaded gray. Source: BLS via FRED, NBER.
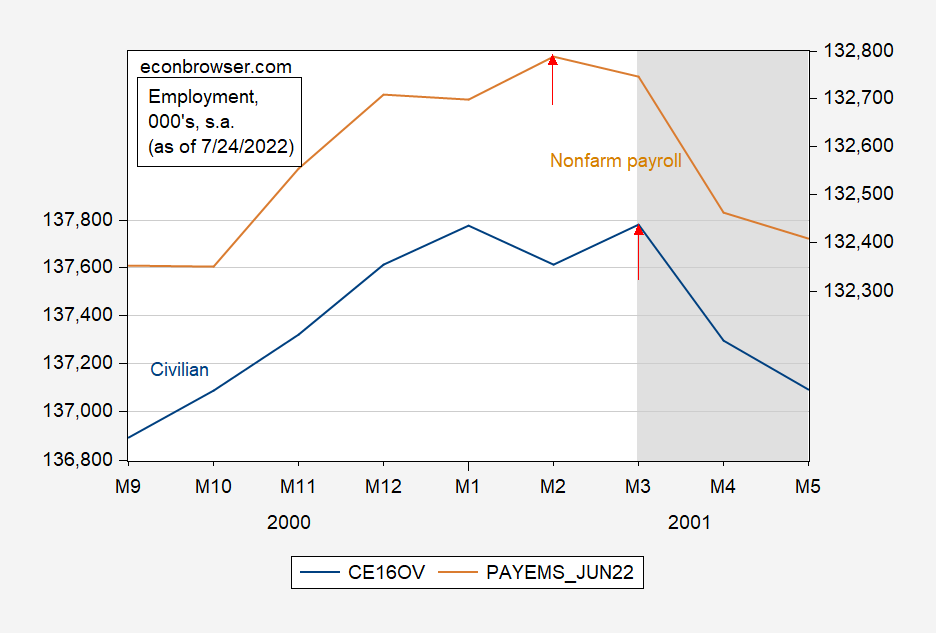
Figure 3: Civilian employment over age 16 (blue, left log scale), nonfarm payroll employment (tan, right log scale), both in 1000’s, seasonally adjusted, both as of 7/24/2022.NBER defined peak-to-trough recession dates shaded gray. Source: BLS via FRED, NBER.

Figure 4: Civilian employment over age 16 (blue, left log scale), nonfarm payroll employment (tan, right log scale), both in 1000’s, seasonally adjusted, both as of 7/24/2022. NBER defined peak-to-trough recession dates shaded gray. Source: BLS via FRED, NBER.
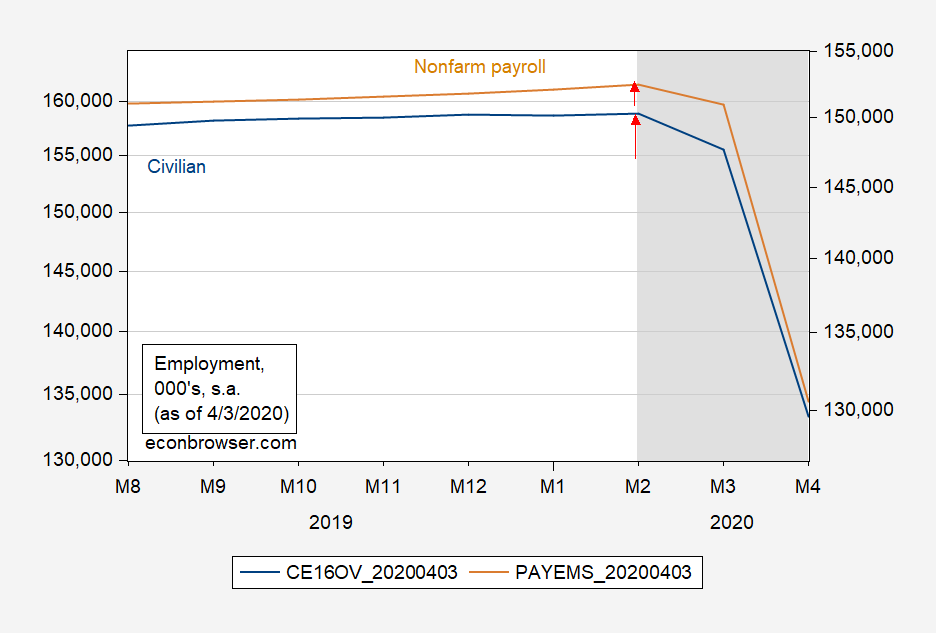
Figure 5: Civilian employment over age 16 (blue, left log scale), nonfarm payroll employment (tan, right log scale), both in 1000’s, seasonally adjusted, both as of 7/24/2022. NBER defined peak-to-trough recession dates shaded gray. Source: BLS via FRED, NBER.
Only in one case does the civilian employment series (household survey) peak before the nonfarm payroll series (establishment survey). Now, these are the final revised series. What do the series look in “real time”, i.e., as observers were contemporaneously assessing the onset of a recession? The corresponding figures are shown in Figures 6-9.
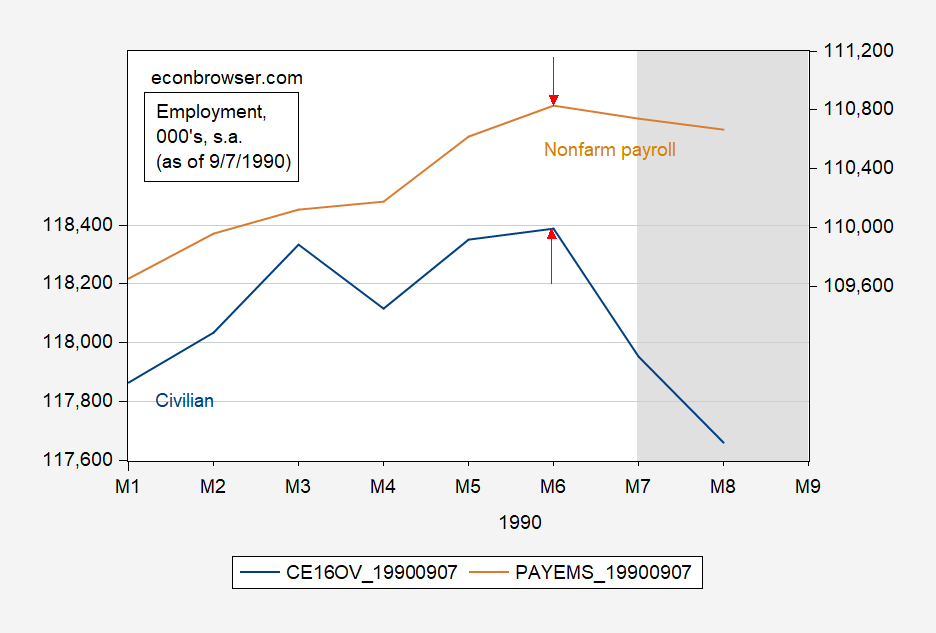
Figure 6: Civilian employment over age 16 (blue, left log scale), nonfarm payroll employment (tan, right log scale), both in 1000’s, seasonally adjusted, both as of 6/7/1990. NBER defined peak-to-trough recession dates shaded gray. Source: BLS via ALFRED, NBER.
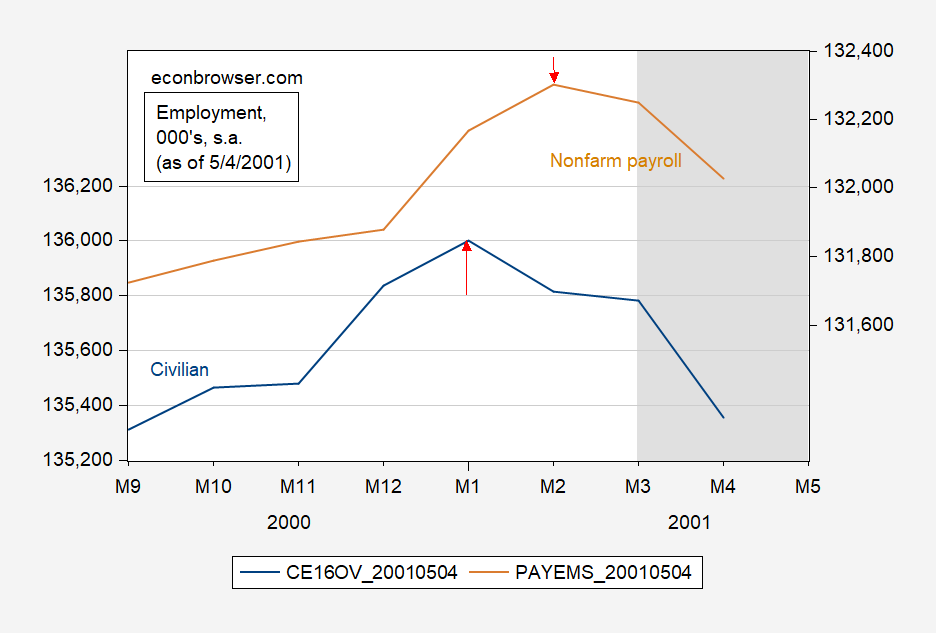
Figure 7: Civilian employment over age 16 (blue, left log scale), nonfarm payroll employment (tan, right log scale), both in 1000’s, seasonally adjusted, both as of 5/4/2001. NBER defined peak-to-trough recession dates shaded gray. Source: BLS via ALFRED, NBER.
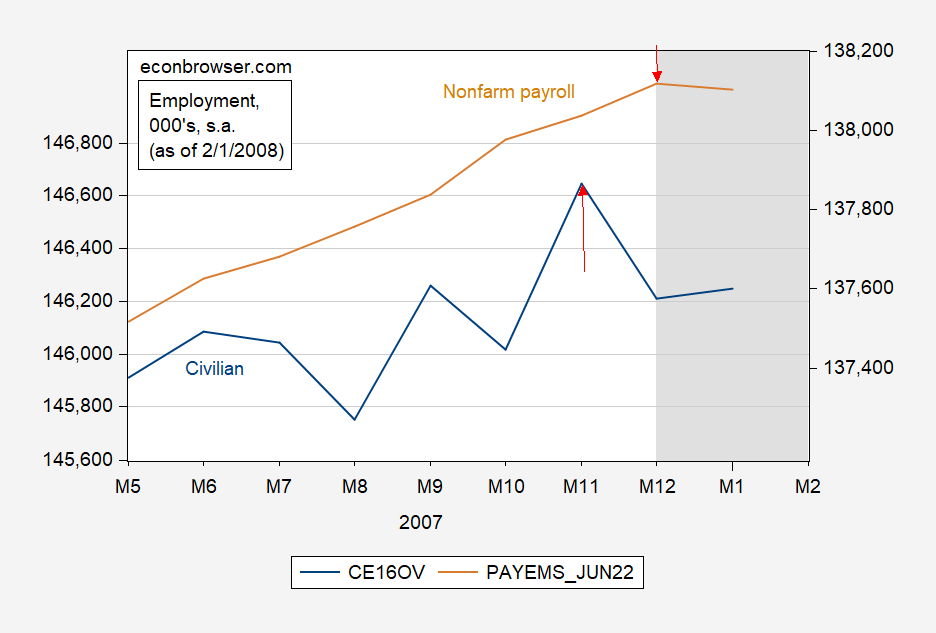
Figure 8: Civilian employment over age 16 (blue, left log scale), nonfarm payroll employment (tan, right log scale), both in 1000’s, seasonally adjusted, both as of 2/1/2008. NBER defined peak-to-trough recession dates shaded gray. Source: BLS via ALFRED, NBER.
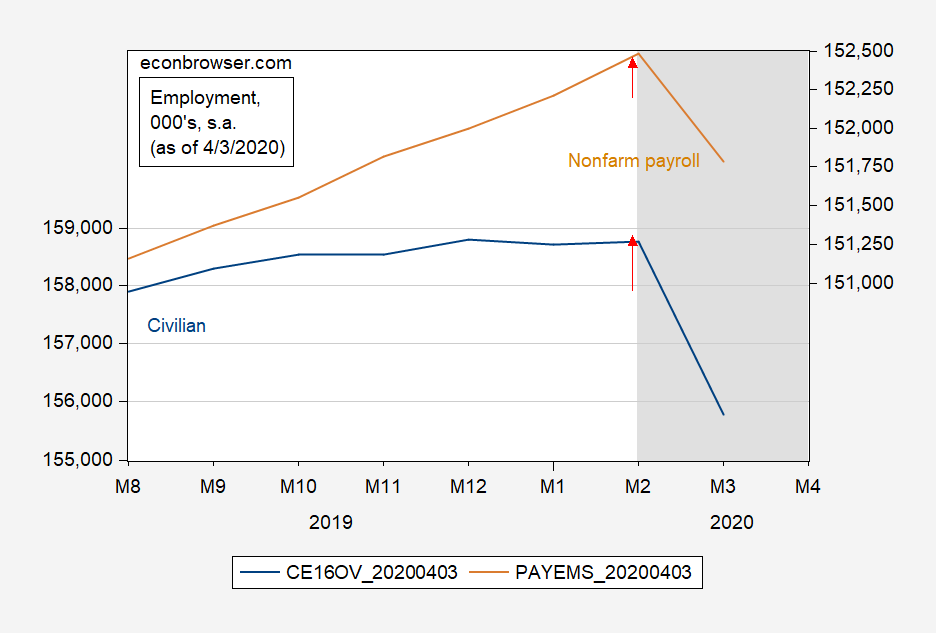
Figure 9: Civilian employment over age 16 (blue, left log scale), nonfarm payroll employment (tan, right log scale), both in 1000’s, seasonally adjusted, both as of 4/3/2020. NBER defined peak-to-trough recession dates shaded gray. Source: BLS via ALFRED, NBER.
In real time, the household series turns one month earlier than the establishment in two cases (2001, 2007), and twice the turning points are the same time (1990 and 2020). In the revisions, the civilian series peaks are moved earlier once (1990), and later by two months (2001). The NFP peak is moved later once (2001 recession).
I do not think one take too much from the current flattening out of the household series. With this in mind, here’s a recap of the two series, plus the household series adjusted to a NFP concept.
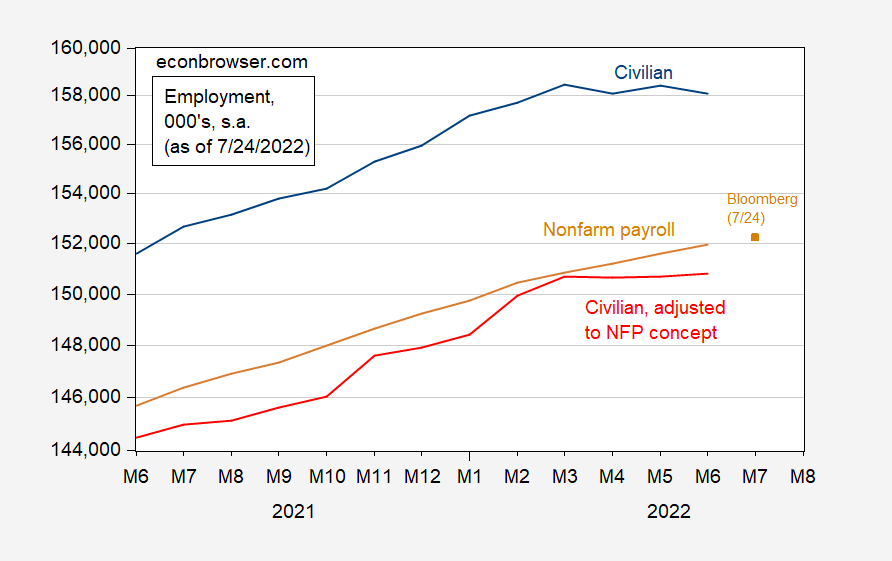
Figure 10: Civilian employment over age 16 (blue), civilian employment adjusted to nonfarm payroll concept (red), nonfarm payroll employment (tan), all in 1000’s on log scale, seasonally adjusted, all as of 7/24/2022. Source: BLS via FRED.
More By This Author:
Will Commodity Prices Continue To Sustain Inflation?GDP Nowcasts
If We End Up Talking about the Global Recession of 2023, What/Who Will We Blame?
Disclosure: None.


