

Image Source: Pexels
Back to Basics
Think of an equity as a perpetual bond with a variable coupon. Like a bond, its price will rise and fall with interest rates. Unlike bonds, equities have variable dividends, or coupons, which tend to increase over time.
At any point in time, the price and value of a bond are the same. This is not necessarily the case for equities. The vector affecting a bond’s value is solely interest rates. With coupons static at the issue level, when interest rates change, bond prices change too.
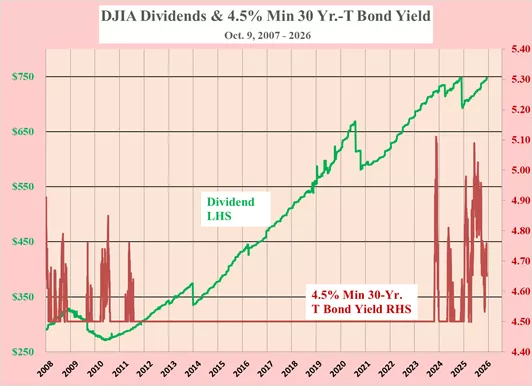
Over time, dividends change. This is the second vector needed to calculate the Dividend Discount Value (DDV) of the DJIA. The two vectors are the trailing 52-week dividend and the yield of the 30-year T bond, with a minimum of 4.5%.
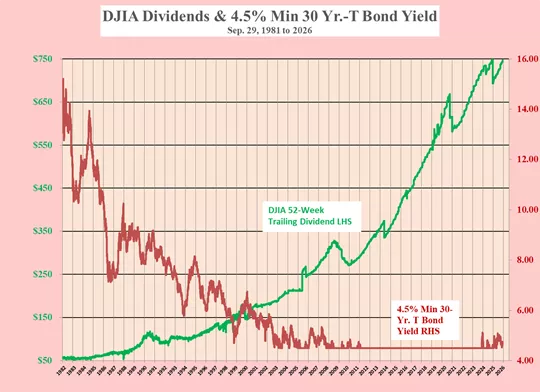
The decline of the 30-year T-bond yield from 1981 through Lehman was very positive for the bond market and the DJIA alike. The simultaneous rise in the DJIA dividend added further to its DDV.
The argument for selecting a minimum yield on the T bond of 4.5% rate is, in short, a combination of the last British Consol rate of 2.5%, at a time of no inflation, plus the Central Banks’ desired inflation rate of 2.0%.
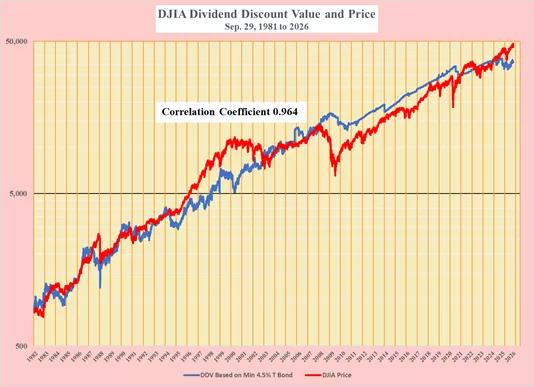
The blue line in the chart below shows the daily calculated DDV of the DJIA, and the red line its daily price since the end of the Great Bear market in bonds on September 29, 1981, when the 30-year T bond hit 15.2%.
The causal correlation between the daily price and DDV of the DJIA at 0.964 is phenomenally high over such a long period. From this, there is a high probability that the two lines should soon merge.
Such an outcome could stem from either the DJIA’s DVD rising or its price falling, or both. The next two charts are the same as above, but on linear scales and from two different starting points, the pre-Lehman peak and the start of COVID-19.
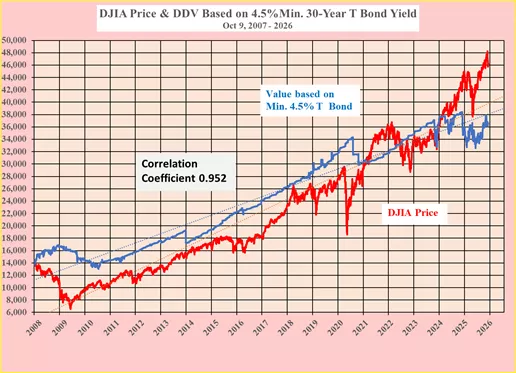
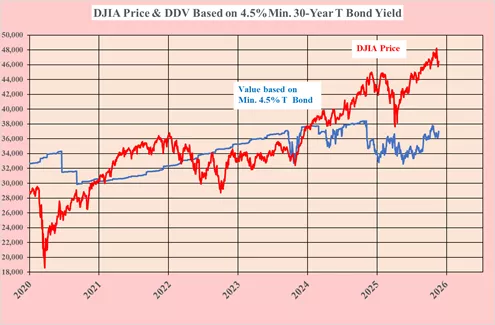
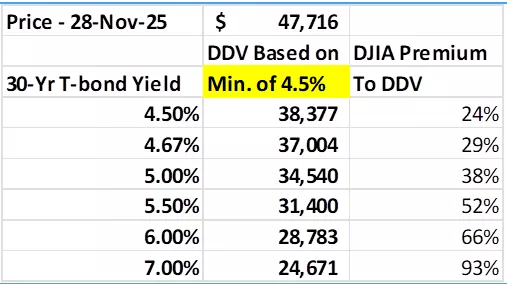
Most of the heavy lifting of the DDV in both shorter-term charts is attributable to the increase in the DJIA dividend, as the 30-year T-bond yield has been below 4.5%. It is only over the past year that the 30-year T-bond yield has had any impact on the DDV, and that has been negative as it has risen above 4.5%. Keeping the DDV below 38,377.
The following chart shows the differential between the DJIA and its DDV compared to the actual price since 1981.
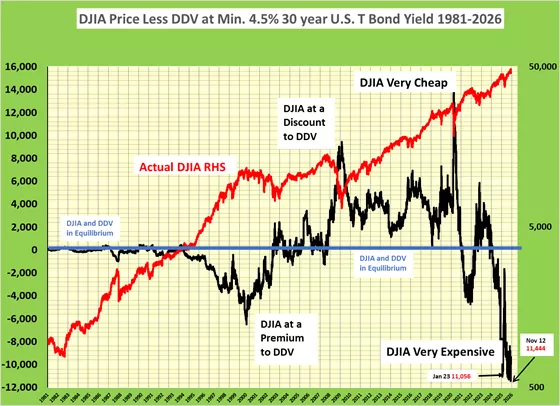
On November 12, 2025, the DJIA closed at 48,255, its highest level ever. The DDV of the DJIA stood at 36,811, leaving a gap between price and value of 11,444. In absolute terms, this is the most expensive the DJIA has ever been.
Looking to the future
So far, this paper has used historical daily data to calculate the DVD and to compare it with the DJIA. With high probability, this relationship should continue to hold, and the value and price should revert to equilibrium.
The payout ratio of the DJIA is 39%, well below the 45-year historical average of 57% so it is unlikely that weakness in the DDV will stem from a falling dividend. It seems much more likely that long-term bond rates will rise with the ever-mounting US Government debt at $38.4 trillion. Perhaps we are about to see a repeat of the rising inflation and long-term rates of the period from 1965 to 1981.
Today, the DJIA is at a 29% premium to its DDV. At a 30-year T-bond yield of 5% it would rise to 38% and beyond, as shown in the following table.
More By This Author:
DJIA - Bears Are Roaring
DJIA Price Exceeds Its Value By Historical Record - Sell
DJIA Far Too Early To Buy. Trump Chaos Reigns


Comments
Log in or sign up to join the conversation.