
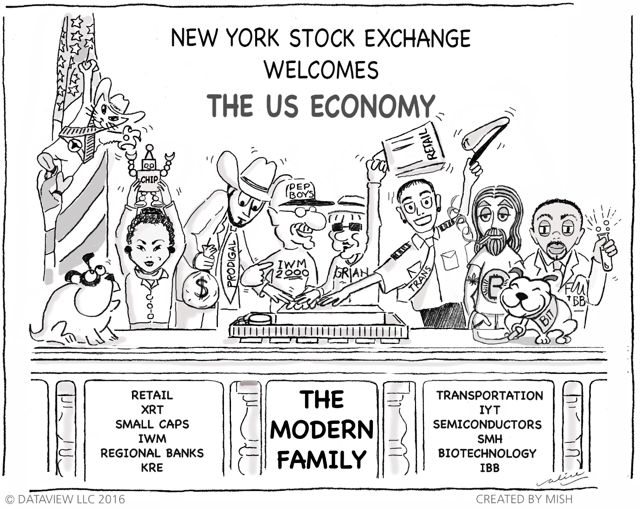
Here is the Economic Modern Family ringing the bell at the NYSE!

(Click on image to enlarge)
I feel like there is so much to talk about, that at the end of the day (week), the talking points matter little compared to the weekly charts of the Economic Modern Family.
With better-than-expected earnings, geopolitics, gold on new highs, debt rising, politics, and mixed economic data, the Family has remained in the trading range for months now.
First a word about long bonds TLT

After rising yields and a big drop in TLT, the trend may have reversed.
Why is this important?
TLT is a gateway to assess risk on or off in the market.
TLT continues to underperform SPY.
Real Motion (momentum) on this weekly chart shows a bullish divergence interestingly.
However, TLT is scraping along the 50-week moving average (blue).
This all means that while TLT has bounced marginally from the recent lows, the rally is more noise than a sea change.
Where does TLT get interesting?
A close and hold over 100.
Depending on where long bonds and yields go as we head closer to the election and beyond, we can see quite clearly that the members of the Family are optimistic, but not ready to jump for joy.
Beginning with Granny Retail XRT-she has been on my mind more than any of the other members.
The chart shows the weekly price activity since May. However, XRT has had a staggering 10-month trading range between $70 and $80.
The state of the consumer is in question with evidence of strength and concerns.
Nonetheless, should XRT take out the trading range and sustain the breakout, then we would consider that to be an excellent technical signal to be follow.
Granddad Russell 2000 IWM tested the highs, even made new 2024 highs earlier last week.
The good news is that IWM closed strong last week.
Although, we continue to wait for the index to clear and close over the 2024 intraday high or 228.63.
Big Brother Biotechnology, IBB, remains stuck in its weekly trading range.
Remember, the longer the range sustains, the better the move out of it tends to be. IBB gets interesting over 150.
The star of the week is Regional Banks KRE.
With the weekly close on new 52-week highs, we are encouraged by the breakout but would prefer to see a move and hold over $61 to get more bullish.
Looking at Sister Semiconductors SMH,
Considering the Taiwan Semiconductors earnings beat and Nvidia’s upgrades, SMH closed red on the week.
We have been expressing that SMH needs to stay in the game and not necessarily lead the rally. She is listening thus far.
Transportation IYT merits eyes this coming week.
First, IYT made a new all-time high.
Secondly, after making those highs, the price reversed leaving a potential topping pattern.
Let’s not forget this is still the volatile month of October.
Now, IYT should hold 69.50 if good.
Lastly, there is Bitcoin BTCUSD.

Between February 2024 to March 2024, Bitcoin made the yearly trading range thus far.
Roughly between $42k to $74k is where it traded in less than a month’s time.
$71, 285 is the highest weekly close in 2024.
This past week, we saw Bitcoin show signs of decoupling from its status as a risk asset.
Nevertheless, our newest Family member, our ‘tween,’ still must work it out and clear the top of the range.
If you put the whole family together, the lesson is this.
Bears tend to get short at the bottom of a range anticipating the price well break below.
And bulls tend to get bullish at the top of the range anticipating the price will break out.
Testing the top of a trading range, while healthy, is not the same thing as breaking out of the trading range.
More By This Author:
Market Outlook After A Staggering Week Of Data
The Current State Of The Markets From A Macroeconomic Perspective
Hump Wednesday: Fresh Look At Long Bonds TLT


Comments
Log in or sign up to join the conversation.