
From 1/21/2025 to 3/10/2025, the 2 year constant maturity yield fell by 40 bps.
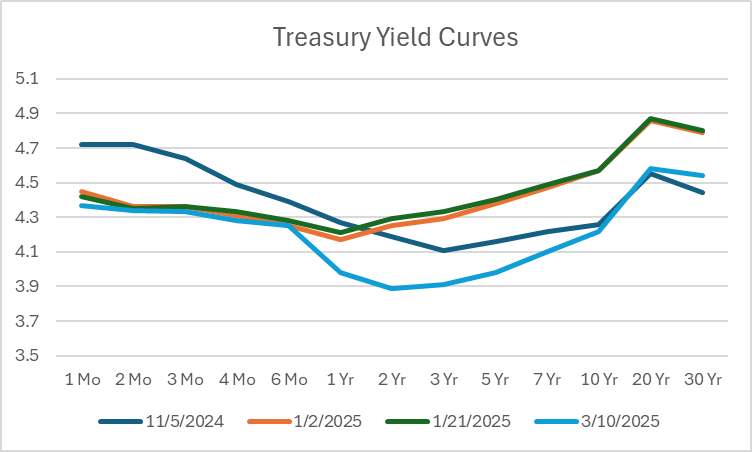
Figure 1: Yield curves as of 11/5/2024 (blue), as of 1/2 /2025 (tan), as of 1/21/2025 (green), as of 3/10/2025 (light blue). Source: Treasury.
Using the pureexpectations hypothesis of the term structure (i.e., no term premia at 6 months and 12 months maturities), the 6 month yield expected 6 months ahead has fallen by about 43 bps since Inauguration day, and 66 bps since 2/12. Here’s a time series graph:
(Click on image to enlarge)
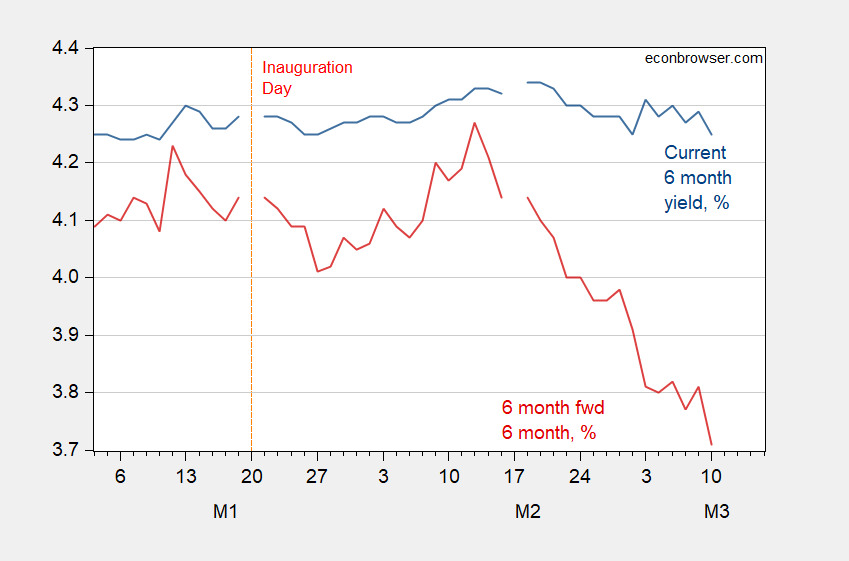
Figure 2: Six month constant maturity yield (blue), and six month forward six months (red), %. Source: Treasury and author’s calculations.
More By This Author:
Why Shouldn’t The Stock Market Be Crashing?GDPNow And Other Predictions
Economic Policy Uncertainty Through 3/6/2025: Through The Roof


Comments
Log in or sign up to join the conversation.