Day Chart Elliott Wave Technical Analysis: USD/CAD
USD/CAD Elliott Wave Analysis Trading Lounge Day Chart, 25 September 23
U.S.Dollar /Canadian Dollar(USD/CAD) Day Chart
USD/CAD Elliott Wave Technical Analysis
Function: Counter Trend
Mode: corrective
Structure: likely zigzag in wave 2
Position: wave 2 of A
Direction Next lower Degrees:corrective wave C of 2
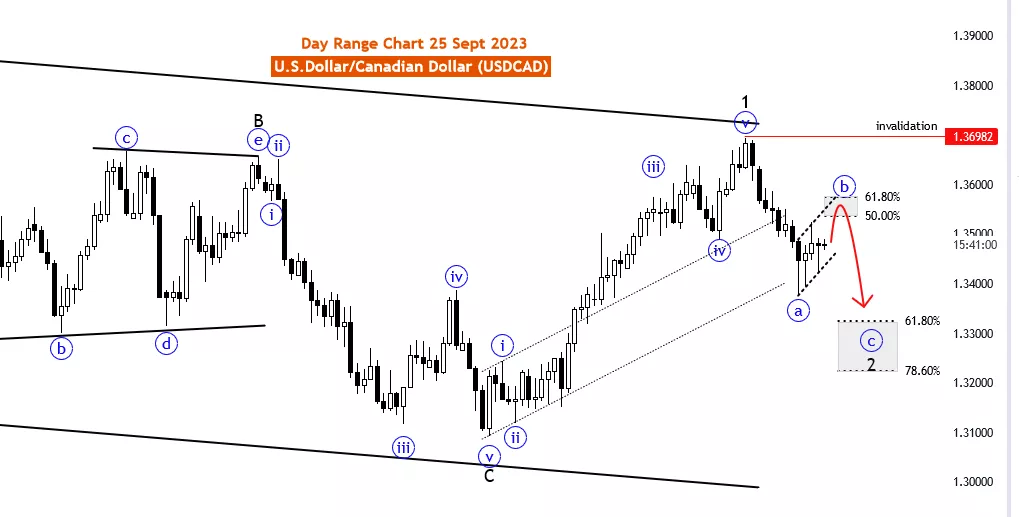
Details: Blue Wave “A” of 2 completed. now corrective wave B of 2 in play ,after that wave C of 2 expected . Wave Cancel invalid level: 1.36982
The USD/CAD Elliott Wave Analysis on 25 September 23, focuses on the daily chart of the U.S. Dollar/Canadian Dollar (USD/CAD) currency pair. Utilizing Elliott Wave theory, the analysis aims to provide insights into potential market trends and movements.
The identified Function in this analysis is "Counter Trend," indicating a focus on identifying and interpreting market movements that are contrary to the prevailing trend. In this context, "counter trend" suggests the analysis is aimed at potential reversals or corrections within the market.
The Mode is described as "corrective," implying that the market is presently undergoing a corrective phase. Corrective phases typically follow strong trends and are characterized by price movements aiming to retrace or adjust the preceding trend.
The Market Structure is outlined as a "likely zigzag in wave 2." A zigzag pattern is a specific corrective wave pattern within Elliott Wave theory, typically consisting of three waves labeled A, B, and C. The focus here is on the second wave (wave 2) within this zigzag pattern.
The Position signifies that the analysis is centered on "wave 2 of A." This highlights the importance of wave 2 within the broader wave structure, suggesting it may offer significant trading opportunities.
The Direction Next Lower Degrees points to the analysis being attentive to "corrective wave C of 2." This implies a focus on the development of wave C within the second wave of the Elliott Wave sequence.
In the Details section, it is noted that "Blue Wave 'A' of 2" has been completed. The market is currently in the phase of "corrective wave B of 2," with an expectation of "wave C of 2" to follow. The "Wave Cancel invalid level" is specified as 1.36982, providing a reference point for traders.
In summary, the USD/CAD Elliott Wave Analysis on 25 September 23, suggests that the market is in a corrective phase, focusing on the second wave (wave 2) of a likely zigzag pattern. Traders are advised to monitor the development of wave C of 2 and pay attention to the specified invalid level for potential trading opportunities, emphasizing the importance of risk management in any trading strategy.
(Click on image to enlarge)

More By This Author:
Stock Trading: AAPL, AMZN, NVDA, TSLA, GOOGL, META, NFLX, MSFT
Elliott Wave Technical Analysis: AAVEUSD - Friday, Sept 22
Day Chart Elliott Wave Technical Analysis: GBPJPY - Friday Sept 22
Analyst Peter Mathers TradingLounge™ Australian Financial Services Licence - AFSL 317817


