

Image Source: Pexels
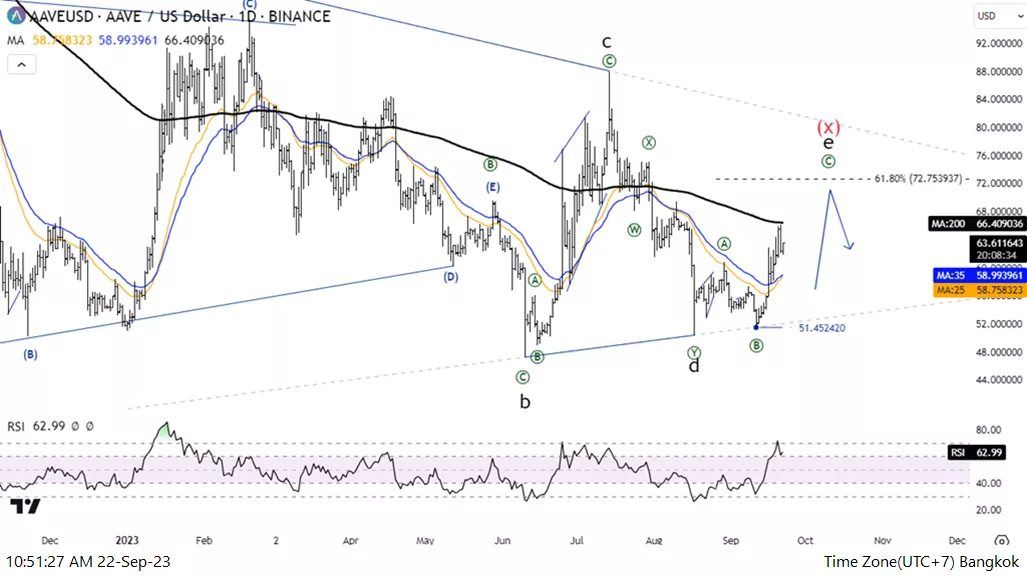
Elliott Wave Analysis TradingLounge Daily Chart, 22 September 23,
AAVE/U.S. dollar(AAVEUSD)
AAVEUSD Elliott Wave Technical Analysis
Function: Counter Trend
Mode: Corrective
Structure: Zigzag
Position: Wave (C)
Direction Next higher Degrees: Wave E of Triangle
Wave Cancel invalid Level:
Details: the  Movement within Triangle wave E equal 61.8% of wave C at 72.753

AAVE/U.S. dollar(AAVEUSD)Trading Strategy: AAVE overview is still in a downtrend due to the price below the MA200 Line, which is a movement within the triangle  so when a triangle is complete the price will decline again, Which an increase is just a short-term

AAVE/U.S. dollar(AAVEUSD)Technical Indicators: The price is a below  the MA200 indicating a downtrend,  RSI is a Bullish Momentum.

TradingLounge Analyst: Kittiampon Somboonsod, CEWA
(Click on image to enlarge)
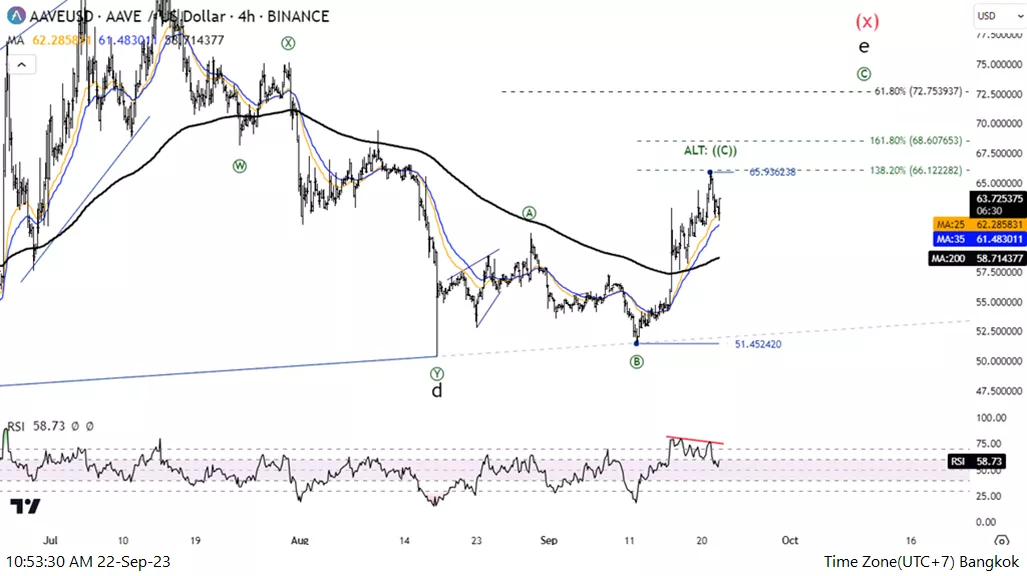
Elliott Wave Analysis TradingLounge 4H Chart, 22 September 23,
AAVE/U.S. dollar(AAVEUSD)
AAVEUSD Elliott Wave Technical Analysis
Function: Counter Trend
Mode: Corrective
Structure: Zigzag
Position: Wave (C)
Direction Next higher Degrees: Wave E of Triangle
Wave Cancel invalid Level:
Details: the  Movement within Triangle wave E equal 61.8% of wave C at 72.753

AAVE/U.S. dollar(AAVEUSD)Trading Strategy: AAVE overview is still in a downtrend, which is a movement within the triangle  so may be a short-term pull-back  when a triangle is complete the price will decline again,

AAVE/U.S. dollar(AAVEUSD)Technical Indicators: The price is a above the MA200 indicating an Uptrend, RSI is a Overbought.
(Click on image to enlarge)
More By This Author:
4 Hour Chart Elliott Wave Technical Analysis: GBPJPY - Friday, Sept 22
Elliott Wave Technical Analysis: Ethereum, Thursday, Sept. 21
Day Chart Elliott Wave Technical Analysis: Australian Dollar, Thursday, Sept. 21


Comments
Log in or sign up to join the conversation.