
AUDUSD Elliott Wave Analysis Trading Lounge Day Chart, Thursday, Sept. 21

Australian Dollar/U.S. Dollar (FXE) Day Chart
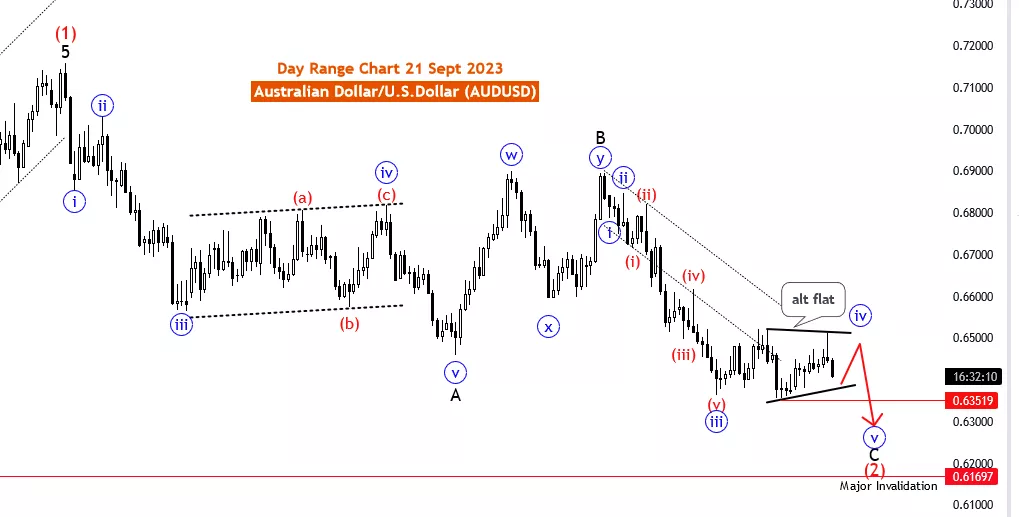
AUDUSD Elliott Wave Technical Analysis
Function: main counter Trend
Mode: sideways in wave 4 of C
Structure: Wave 4 of C
Position: Main Red wave 2
Direction Next lower Degrees: blue wave 5
Details: blue wave 4 of C of 2 still in play as sideways. Wave Cancel invalid level: 0.61697
The AUDUSD Elliott Wave Analysis on 21 September 23, is conducted on the daily chart of the Australian Dollar/U.S. Dollar (AUDUSD) currency pair. It utilizes Elliott Wave theory to provide insights into potential market movements.
The Function assigned to this analysis is "main counter Trend," indicating its focus on identifying potential counter trend movements. In essence, the analysis aims to pinpoint opportunities for reversals or corrections against the prevailing market direction.
The Market Mode is described as "sideways in wave 4 of C," signifying that the market is currently within a consolidation or corrective phase labeled as "wave 4 of C." Such sideways market modes are typically characterized by horizontal price movements, indicating a lack of clear trend direction.
The Market Structure is identified as "Wave 4 of C," underscoring that the analysis is concentrated on the fourth wave within a larger wave sequence designated as "C." This understanding of the wave structure is crucial for identifying potential reversal or continuation points within the market.
The Position specified within the Elliott Wave pattern is "Main Red wave 2," indicating that the analysis is focused on a specific sub-wave within the second major wave of the Elliott Wave sequence. This level of detail helps traders assess their position within the broader wave pattern.
Regarding the Direction Next Lower Degrees, the analysis mentions "blue wave 5," suggesting that the next significant wave to anticipate is the fifth wave within the current wave structure. This implies that traders should monitor developments in wave 5 once wave 4 is completed.
The Details section notes that "blue wave 4 of C of 2" is still in play and is exhibiting sideways price movement. Sideways phases often occur during market consolidation, where traders await a breakout or further confirmation of the trend direction.
Furthermore, the "Wave Cancel invalid level" is identified at 0.61697. This level serves as a reference point for traders and can become significant in assessing potential changes in market dynamics.
In summary, the AUDUSD Elliott Wave Analysis on 21 September 23, reveals that the market is presently in a corrective phase (wave 4 of C) characterized by sideways price movement. Traders should remain vigilant for potential developments in wave 5, which could offer clarity regarding the future trend direction. The Wave Cancel invalid level is a critical reference point for traders to monitor in their analysis. As in all trading, risk management is essential, and traders should complement their analysis with additional technical and fundamental insights to make well-informed trading decisions.
Technical Analyst : Malik Awais
More By This Author:
4 Hour Chart Elliott Wave Technical Analysis: AUDUSD - Thursday, Sept 21
Day Chart Elliott Wave Technical Analysis: Japanese Yen, Wednesday, Sept. 20
4 Hour Chart Elliott Wave Technical Analysis: Japanese Yen, Wednesday, Sept. 20


Comments
Log in or sign up to join the conversation.