
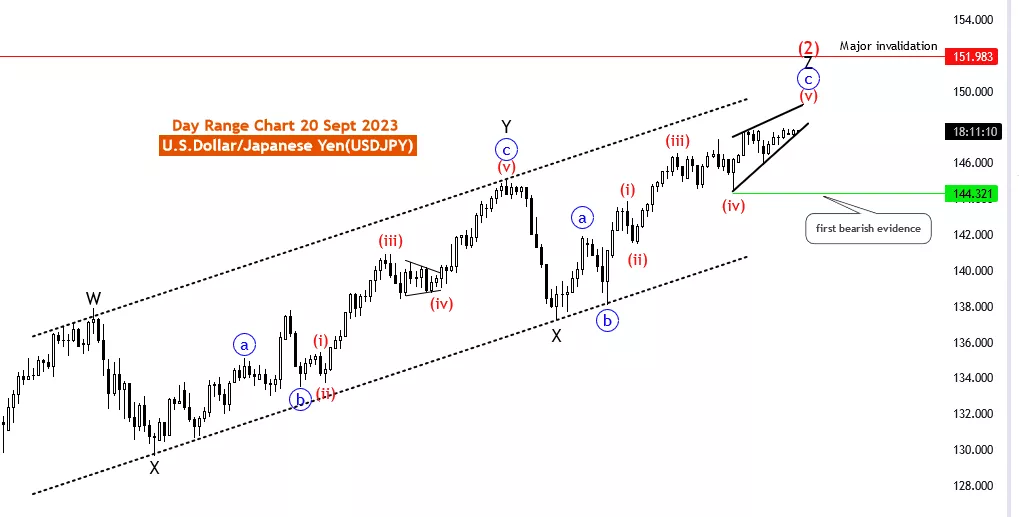
USDJPY Elliott Wave Analysis Trading Lounge Day Chart, Wednesday, Sept. 20

U.S. Dollar/Japanese Yen (FXY) Day Chart
USDJPY Elliott Wave Technical Analysis
Function: Counter Trend
Mode: impulsive
Structure:5 of C
Position: Z of 2
Direction Next lower Degrees: Red wave 3
Details: Red wave 5 of C still in play as ending diagonal, after that new downtrend expected. Major Wave Cancel invalid level: 151.983.
The USDJPY Elliott Wave Analysis, conducted on 20 September 23, focuses on the daily chart of the U.S. Dollar/Japanese Yen (USDJPY) currency pair. Utilizing the Elliott Wave theory, this analysis provides insights into potential market movements.
The designated Function for this analysis is "Counter Trend," signifying the primary objective of identifying potential counter trend movements. Counter-trend analysis seeks opportunities for reversals or corrections against the prevailing market direction.
The Market Mode is characterized as "impulsive," indicating that the market is currently exhibiting strong, decisive price movements. Impulsive market modes are often associated with the continuation of trends or significant price movements in a specific direction.
The Market Structure is defined as "5 of C," highlighting the analysis's focus on the fifth wave within a larger wave sequence referred to as "C." Understanding the wave structure aids in identifying potential reversal points or trend continuations.
The Position within the Elliott Wave pattern is identified as "Z of 2," indicating that the analysis examines a specific sub-wave within the second major wave of the Elliott Wave sequence. This level of detail helps traders gauge their position within the broader wave pattern.
Regarding the Direction Next Lower Degrees, the analysis suggests that "Red wave 3" is expected to follow after the completion of "Red wave 5 of C." This implies the potential for a new downtrend once the ending diagonal formation concludes.
The analysis provides specific Details, noting that "Red wave 5 of C" is still in play as an ending diagonal pattern. Ending diagonals are often characterized by narrowing price ranges and can signal the end of a larger wave sequence.
Furthermore, the "Major Wave Cancel invalid level" is identified at 151.983. This level holds significance as it may serve as a key reference point for traders. A breach of this level could indicate a potential shift in market sentiment or invalidate the current wave count.
In summary, the USDJPY Elliott Wave Analysis on Wednesday, Sept. 20, aims to identify counter trend opportunities within the ongoing wave sequence. The analysis anticipates the completion of the ending diagonal pattern, potentially signaling a new downtrend. Traders are advised to closely monitor the Major Wave Cancel invalid level as it could provide important insights into market dynamics. As always, risk management is crucial when trading in the forex market, and additional technical and fundamental analysis should be used to make well-informed trading decisions.
Technical Analyst : Malik Awais
More By This Author:
Theta Token/U.S. Dollar Elliott Wave Technical Analysis - Wednesday, September 20
4 Hour Chart Elliott Wave Technical Analysis: NZD/USD - Tuesday, September 19
SP500 - NASDAQ 100 - RUSSELL 2000 - DAX 40 - FTSE 100 - ASX 200 Elliott Wave Analysis


Comments
Log in or sign up to join the conversation.