

While year-on-year core rose, month-on-month fell, along with other measures of inflation that are aimed at getting the trend.
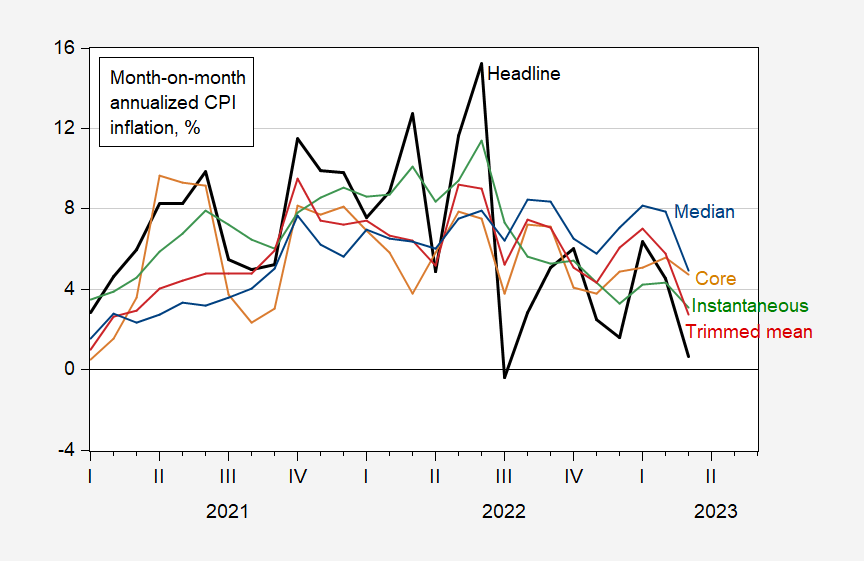
Figure 1: Month-on-month headline CPI inflation (bold black), core (tan), trimmed mean (red), and median (blue); and instantaneous inflation following Eeckhout, a=4, T=12 (green). Source: BLS, Cleveland Fed and Dallas Fed via FRED, and author’s calculations.
Median, trimmed mean, and instantaneous inflation all fell faster than core. This suggests to me inflationary pressures are perhaps cooling off faster than a look restricted to core would suggest.
More By This Author:
How Well Do Adaptive Inflation Expectations Do, 1982-2023?More On Cost-Push Shocks And Inflation Expectations In A Phillips Curve Context
One Year Ahead Inflation Expectations


Comments
Log in or sign up to join the conversation.