
The CPI report on Thursday might be a snoozer hitting expectations of 0.2 percent. If it comes in higher, bears might gain an edge on the market by looking at the Cleveland Fed’s model and crude oil moving forward.
Nowcasting
I’ve been following the Cleveland Fed’s Inflation Nowcasting model for the past year. It hasn’t been terribly accurate, consistently coming in on the high side as disinflation kicked in. The past two years of data shows they lag the trend as shown by this chart from MacroMicro. The Cleveland Fed’s model is consistently low when inflation is rising and consistently high when inflation is falling.
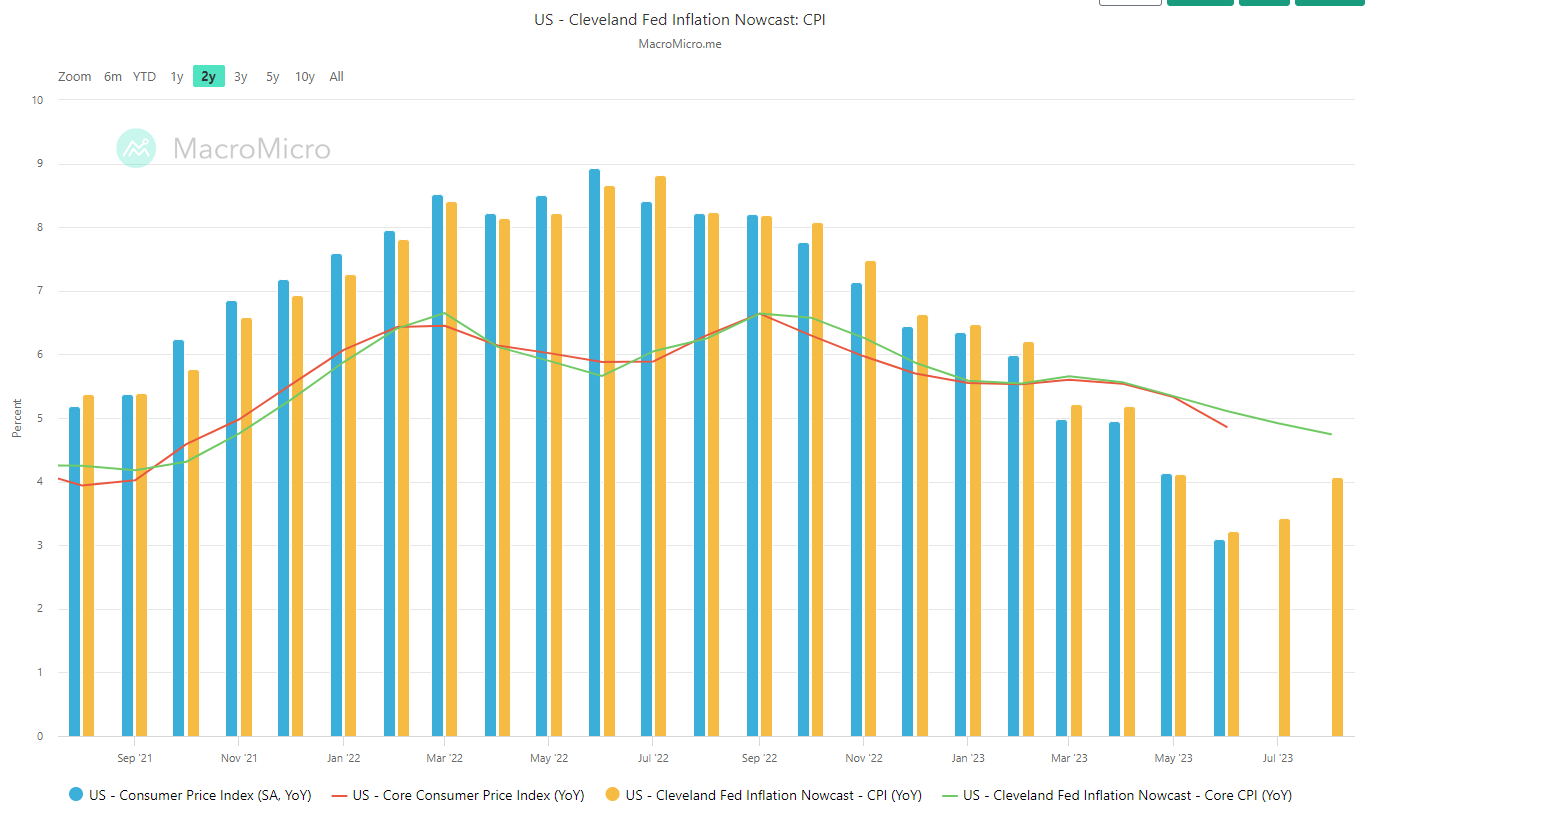
This could give traders an edge if it stays the case.
First, if inflation is rising, the Cleveland Fed numbers might be low. The market currently expects 0.2 percent headline increase and 0.2 percent core increase in July. The Cleveland Fed predicts 0.4 percent for both numbers. Given recent history, I interpret this as 0.2 percent is likely, with some risk of 0.3 percent.
If the trend actually has shifted and Inflation Nowcasting is lagging the other way, the BLS might drop a bearish nuke on the market this month or next. It might come in at the Cleveland Fed’s 0.4 percent number. (An even higher number is not worth speculating on since I think 0.4 percent would be enough for a CNBC Markets in Turmoil graphic.) They also predict 0.8 percent for August currently, though the month has only a week of data. Cleveland Fed’s number for August could change substantially by the BLS’ September release.
The second important piece of information: if the Cleveland Fed’s number misses on the low side, it would open the possibility that price inflation has hit an inflection point.
Another variable to watch: crude oil.
Long-term, the 12-month change in crude oil and the 12-month change in the CPI are correlated in their movements. The peaks and troughs in their 12-month changes have been fairly proximate in time.
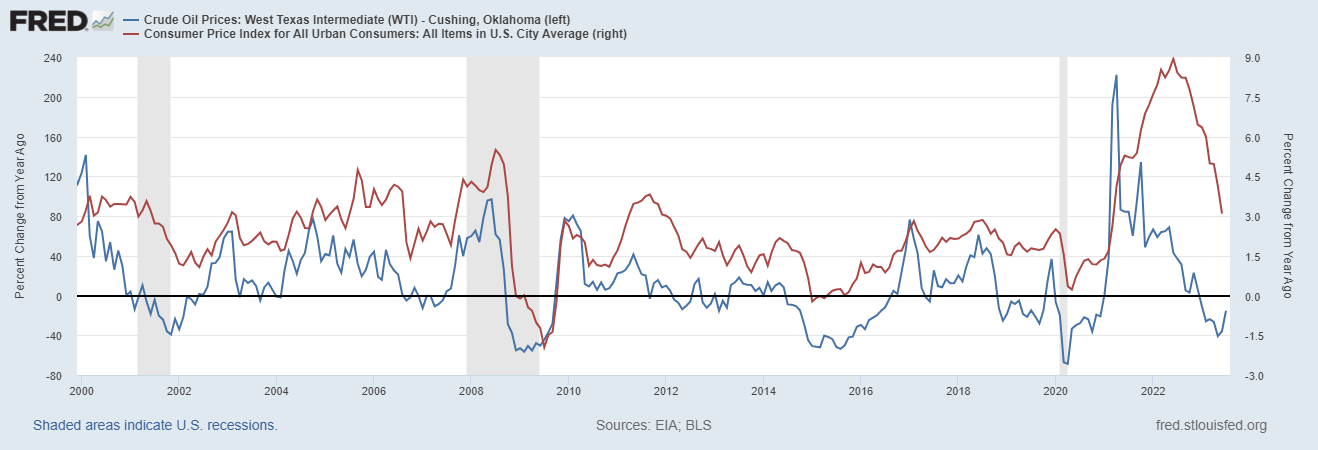
In August 2022, crude ranged from $98 to $85 per barrel. By September it had fallen to a range of $90 to $76. If crude can crack $85 per barrel and stay there, year on year crude prices will be flat as soon as September and start moving higher in December. History says CPI will rise if that’s the case because, at the very least, disinflation via the energy basket will be gone.
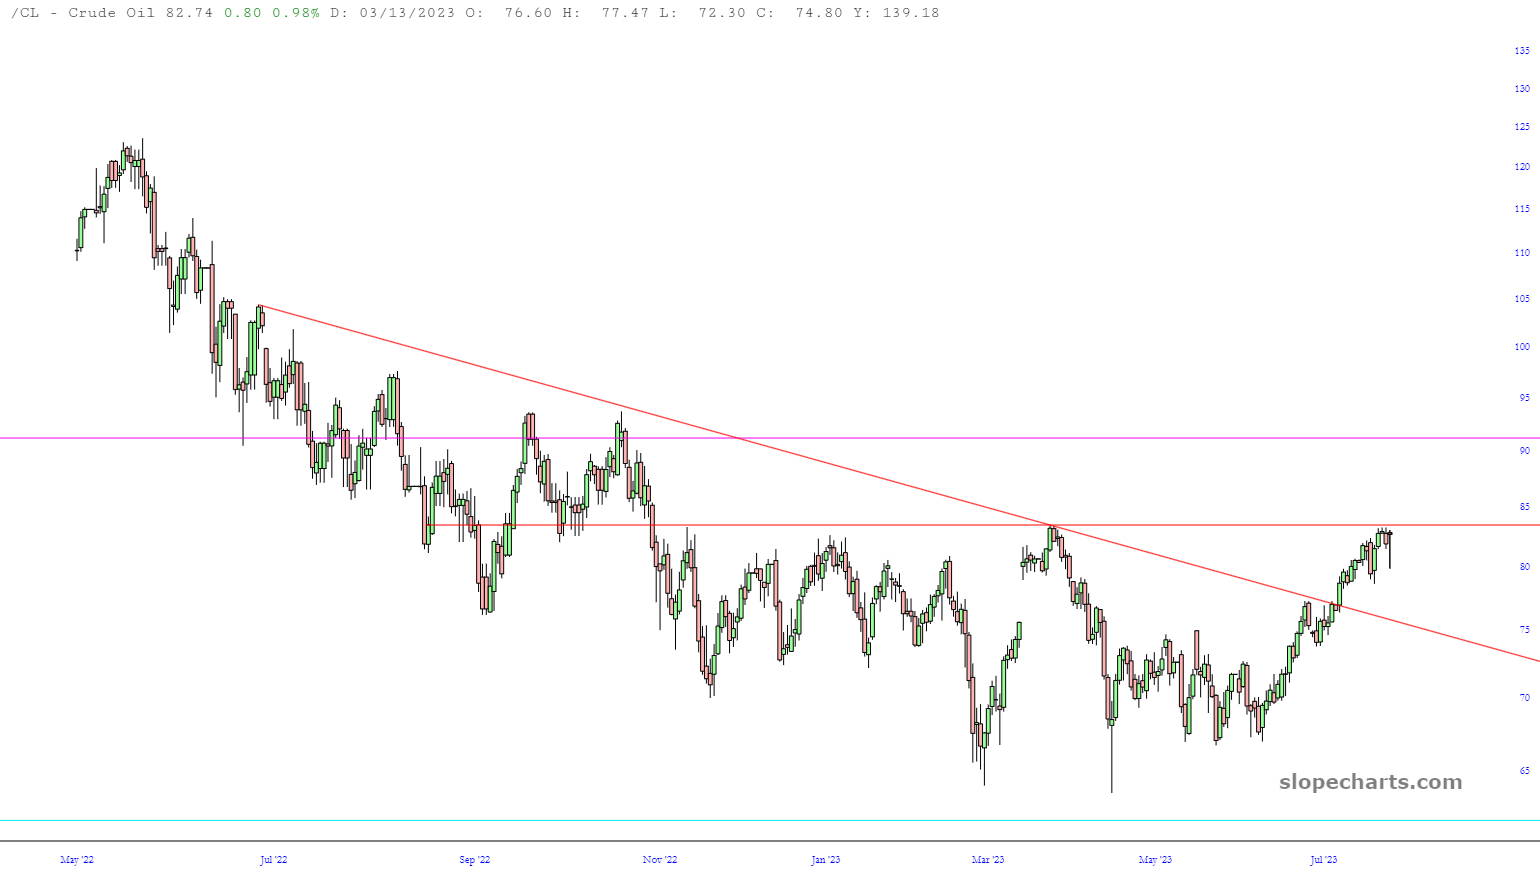
Continuous crude oil contract
Higher crude prices wouldn’t necessarily filter into core inflation right away because of the housing component. There’s a big lag in housing and it accounts for more than 40 percent of core inflation. The dip in prices seen this past year could filter into core readings in the months ahead.
However, in Black Knight’s August 2023 Mortgage Monitor, the firm says their home price index is at a new all-time high. The trend in the Case-Schiller Index (data lags two months) points to a new high coming by July. If crude and home prices are moving higher in the next couple of months, and the inflation readings start coming in hotter than expected, the stock market is in a precarious state.
Finally, I remain partial to the macro bears. There are plenty of signs of slowing growth in the U.S. and abroad. Still, the housing market peaked two years before the stock market topped in 2007. Crude oil wouldn’t peak along with the CPI until well into 2008. Maybe the path to recession will first involve a spike in inflation that either scares the market enough to kick off deflationary selling or forces the Fed to make a hawkish turn at the worst possible moment.
Bears (and bond bulls) have been staring at the chasm between long-bonds and Nasdaq this year, wondering what might trigger their reattachment. The relationship hasn’t always been one-to-one, but in general they have moved in the same direction.
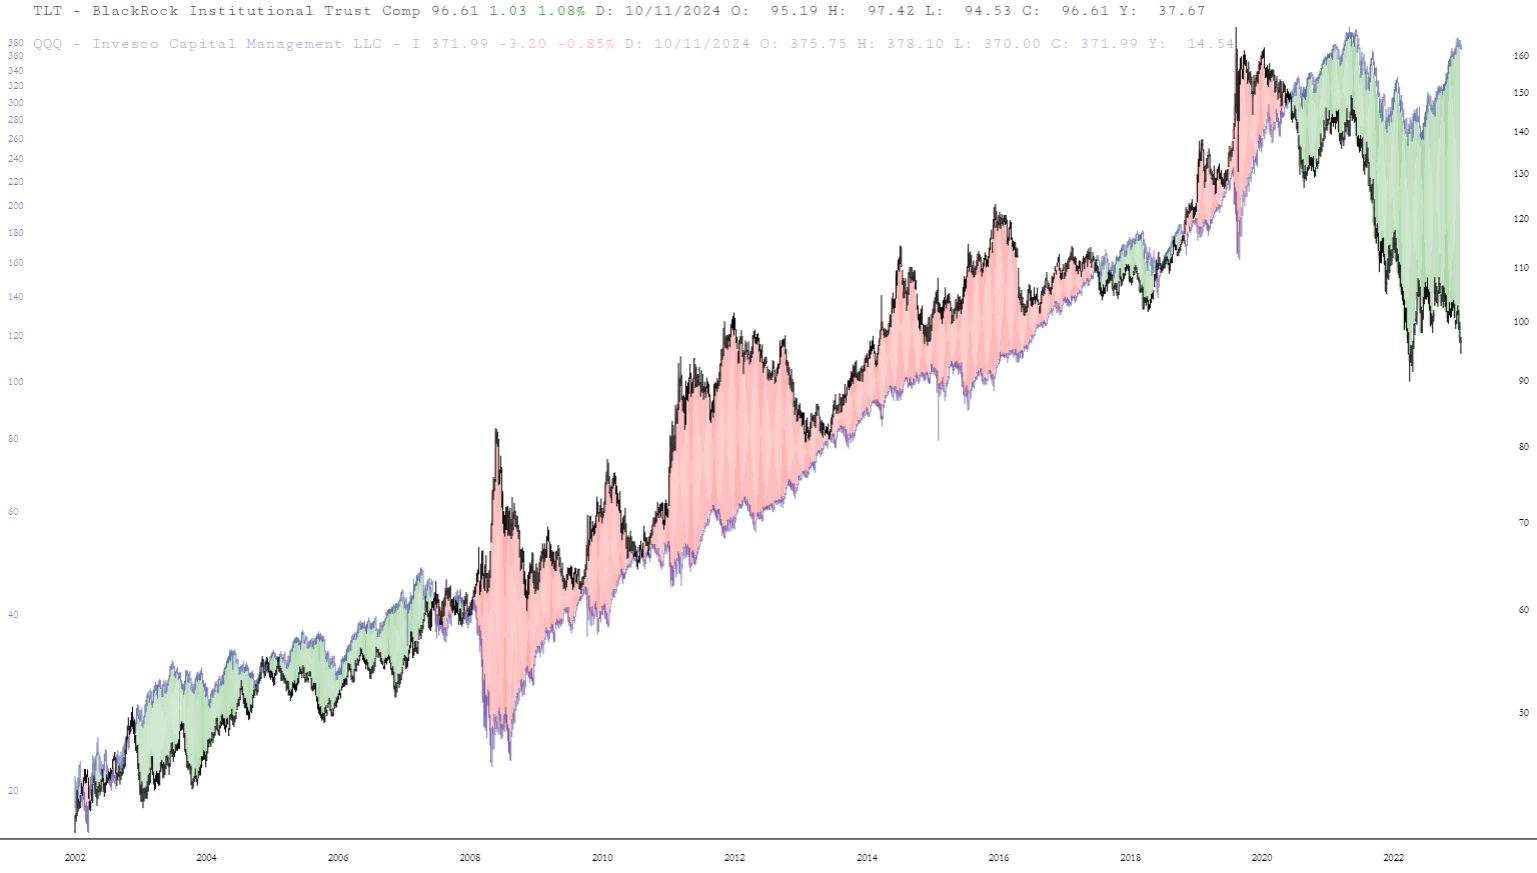
TLT and QQQ
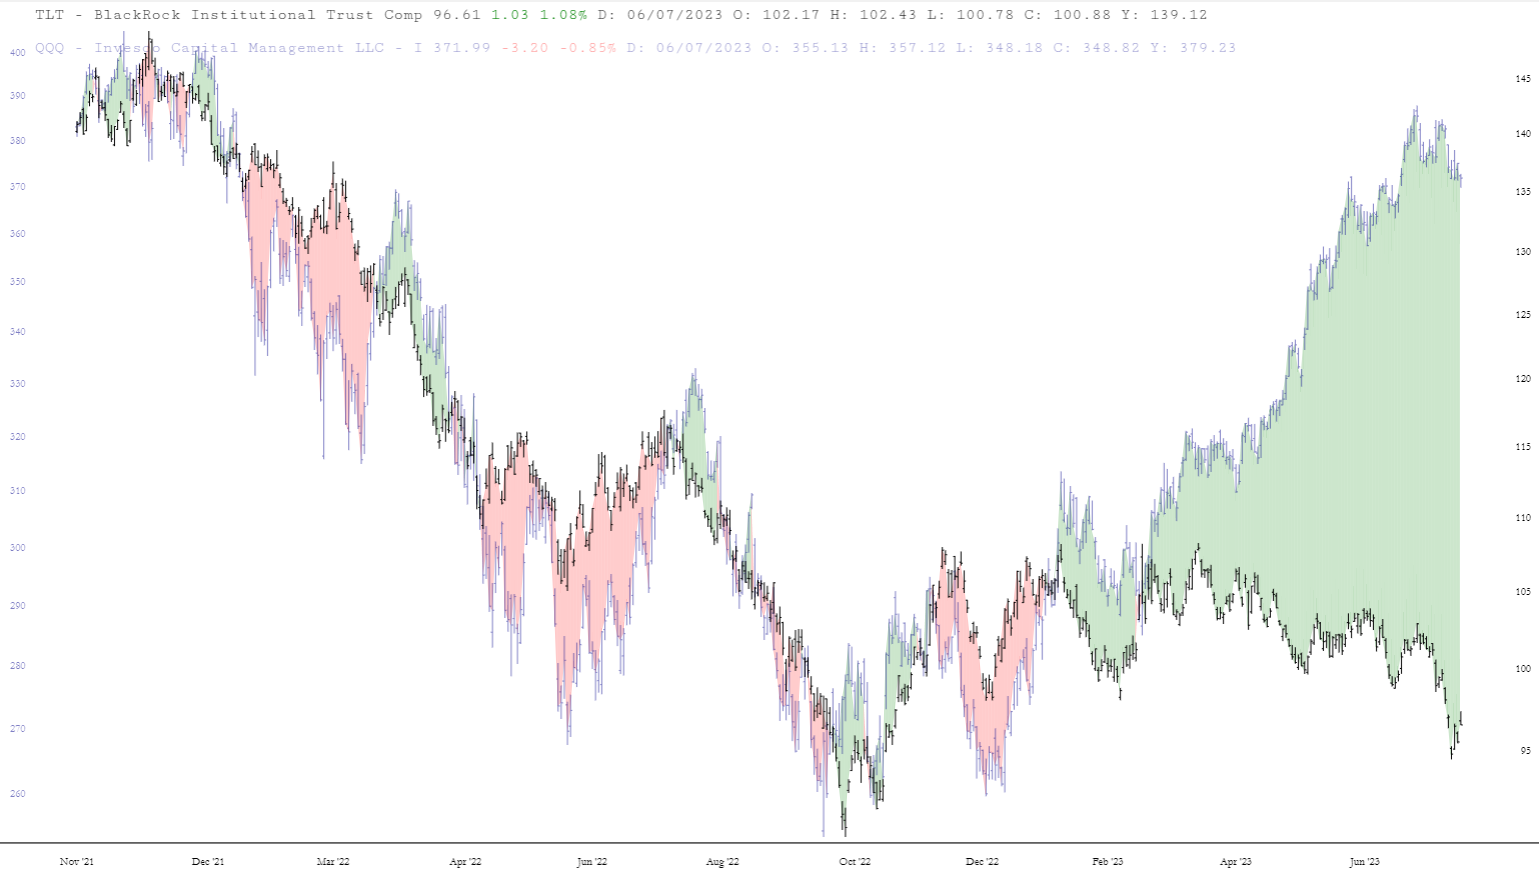
TLT & QQQ more recently, with growing spread
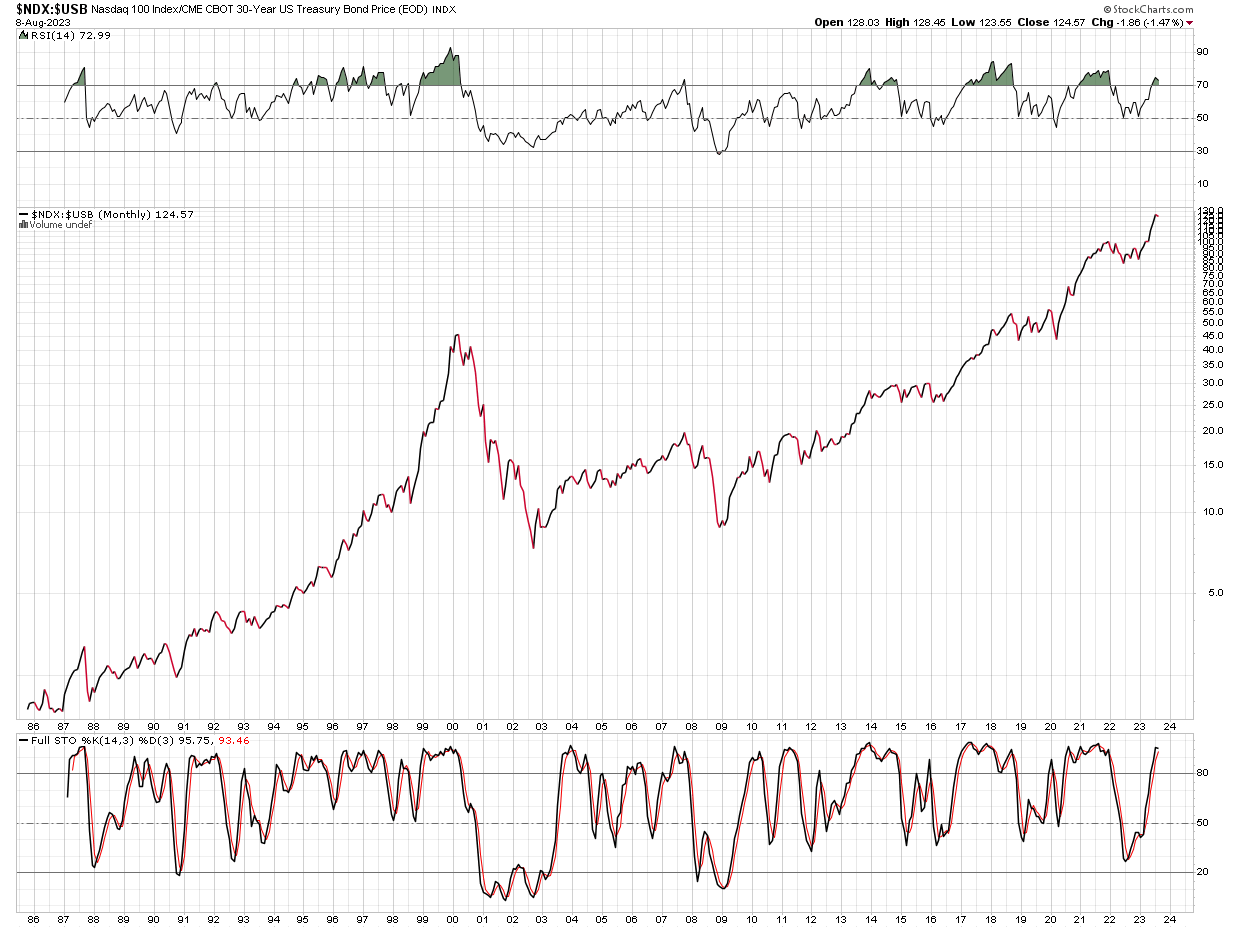
Tim’s MICE chart of stocks divided by rates shows it’s coming up on major support. The NDX divided by the 30-year bond price has its third extension move in 7 years. The prior two peaked in summer 2018 and winter 2021. Finally, there is the NDX and ZB chart, which adjusts for contract roll coming in near the 2000 peak. Relatively speaking, stocks are about as valuable as they’ve ever been relative to bonds.
More By This Author:
Indomitable EliFibonacci Sinkage
Crossunders Of Weakness

Comments
Log in or sign up to join the conversation.