
Market Brief – Bonds Jump As Economic Data Weakens
This past week delivered a trio of market-moving economic releases, CPI, PPI, and the annual employment revisions, that collectively shaped investor expectations heading into next week’s FOMC meeting. Overall, the data continues to suggest a weakening economic environment. While headline CPI rose 0.4% month-over-month, with the annual rate rising to 2.9%, it was primarily contained in services. Food and gasoline were the primary contributors to the upside, while shelter costs remained firm, though slightly decelerated compared to prior months. Given that housing makes up 42% of the CPI calculation, there is little risk that inflation will rise from current levels due to ongoing weakness in the broader housing market.
Producer inflation told a more nuanced story. The August PPI headline ticked lower, but the “core” PPI excluding food, energy, and trade still advanced by 0.3%, translating to a 2.8% annual pace. The data reflected that producers continue absorbing tariffs as weaker demand is evident in select goods and trade margins. Furthermore, they both showed that inflation continues to normalize, and while better than feared, it is not yet at levels where policymakers want it.
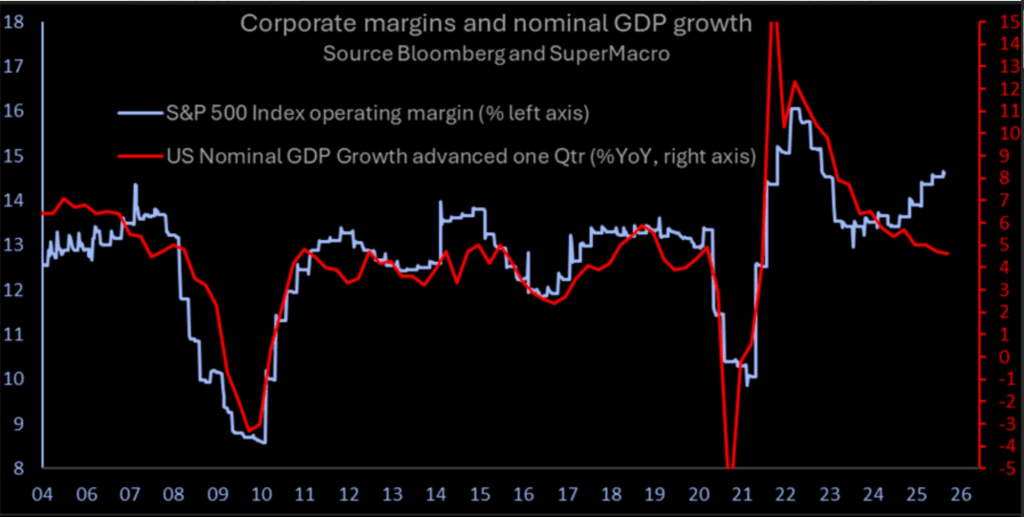
The labor market data carried even greater weight. As we noted in last week’s #BullBearReport, the August nonfarm payrolls grew by just +22,000, far short of expectations, while the unemployment rate climbed to 4.3%. However, this week’s more critical report was the preliminary benchmark revisions, subtracting 911,000 jobs from the prior 12 months. That revision means job growth averaged ~71,000 per month rather than the previously estimated ~147,000. That data should not be overlooked because employment allows consumers to increase economic demand. Given the current gap between corporate profit margins and economic growth, there is a rising risk of disappointment for investors in the coming months.
(Click on image to enlarge)
OUTLOOK: Moderately Bullish / Cautiously Constructive – Inflation remains stickier than ideal, but the labor market’s fragility has tilted the Fed calculus. Treasury yields’ sharp move lower confirms bond traders see a weaker growth path, which provides equities with short-term relief but raises longer-term concerns about economic durability.
Technical Backdrop
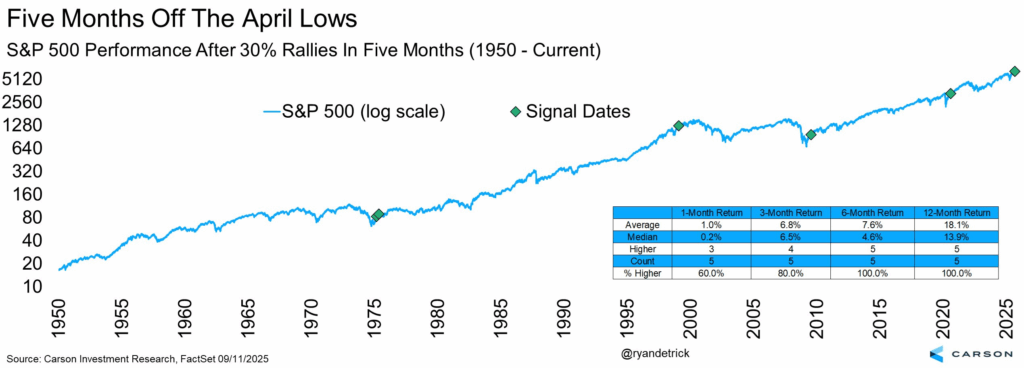
As noted, the markets interpreted the combination of sticky but cooling inflation and softer employment as supportive of a rate cut at the September FOMC. Equities extended their summer gains, with the S&P 500 hovering near record highs. As noted by Carson Research, the market has completed a 30% gain since the April lows, one of the fastest in history, which tends to bode well for further gains over the next few months.
(Click on image to enlarge)
But the most dramatic response came from the Treasury bond market. Yields fell sharply across the curve, with the 2-year Treasury, which tends to lead the Federal Reserve policy changes, dropping nearly 20 basis points on the week as traders priced in not just a 25 bps cut on September 17, but increased odds of additional easing into year-end. The two-year yield suggests the Fed is behind the curve in cutting rates by roughly 80bps.
(Click on image to enlarge)
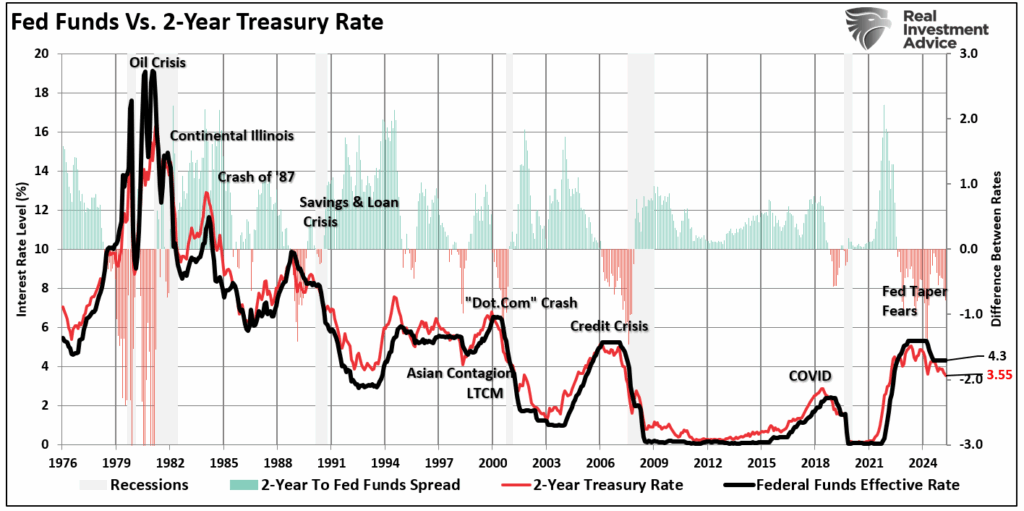
The 10-year yield also slid, flattening the curve’s inversion, as investors anticipated slower growth ahead. This dovish repricing underscores how rapidly Fed expectations can shift when the labor narrative weakens, and it highlights the bond market’s role as the first responder to softer macro signals.
Technically, equity markets are holding up, but signs of fatigue are increasing. The S&P 500, after pushing toward and through recent resistance zones, is trading above its key moving averages of the 20, 50, and 200-day. For example, the 50-day has been rising steadily, supporting pullbacks, and the 200-day continues to anchor the long-term trend. On a shorter scale, recent days’ candles hint at smaller bodies and increased intraday reversals, suggesting that bulls are less aggressive at higher levels.
(Click on image to enlarge)
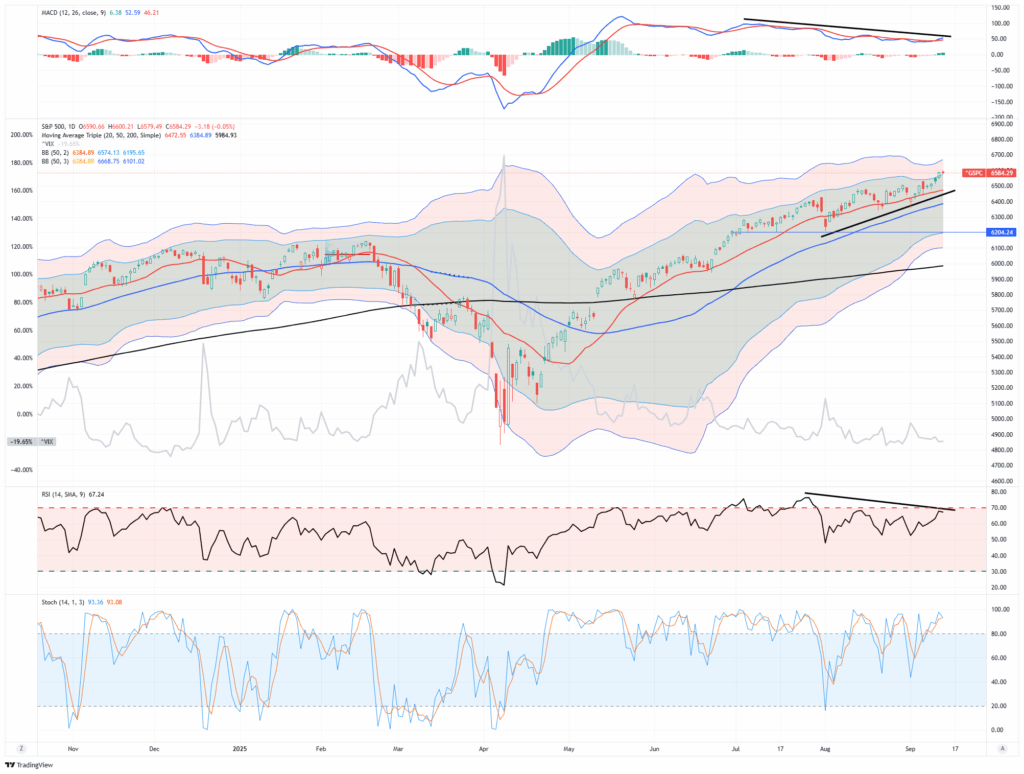
Momentum indicators continue their negative divergence as the market hit all-time highs this past week. We have noted these divergences over the last few weeks, but the market trend remains broadly bullish. Stochastic oscillators have shown instances of overbought conditions in small time frames, occasionally pulling back, but no major “sell signals” yet. Meanwhile, breadth remains a concern: new 52-week highs are fewer relative to all constituents, and many mid- and small-caps lag the large-cap/mega-cap names that continue to lead. In other words, the market increasingly relies on fewer names (often growth/AI- or tech-adjacent) for the advance.
Support and Resistance Levels: The S&P 500’s near-term support lies at the 20-day moving average (~6,500). The 50-day moving average is roughly in the ~6,400 region but there is deeper support near ~6,200, connected with the previous pullback. Resistance is around the most recent highs in the 6,600-6,700 area (2- 3 standard deviations above the 50-DMA). Notably, volatility (as measured by VIX) remains relatively subdued.
OUTLOOK: Neutral / Slightly Bullish with Guardrails – The trend is still up and technically intact. However, momentum is decelerating, and breadth remains a vulnerability. Traders should expect possible pullbacks or consolidation. Continue to risk-management practices.
Key Catalysts Next Week
With markets freshly repricing for Fed cuts, the week ahead spotlights high-impact data and the FOMC decision. While markets are very complacent and rallying on expectations of a Fed rate cut this coming week, a more hawkish FOMC tilt could send prices lower.
(Click on image to enlarge)

OUTLOOK: With so many high-leverage events in a compressed timeframe, volatility risk is elevated. The Fed event (Wed) is the fulcrum. Risk markets should welcome a “dovish enough” cut with steady or downward revisions in the September “dot plot.” However, resistance zones may hold if inflation remains stubborn (especially core) or employment surprises to the upside, and a pullback toward support (6,500 / 6,350-6,400) would be likely. Traders should watch for signals across yield curves, breadth, and option market structure; protective wings may start pricing in outsized moves.
Need Help With Your Investing Strategy?
Are you looking for complete financial, insurance, and estate planning? Need a risk-managed portfolio management strategy to grow and protect your savings? Whatever your needs are, we are here to help.
Covered Call Strategies Gone Wild
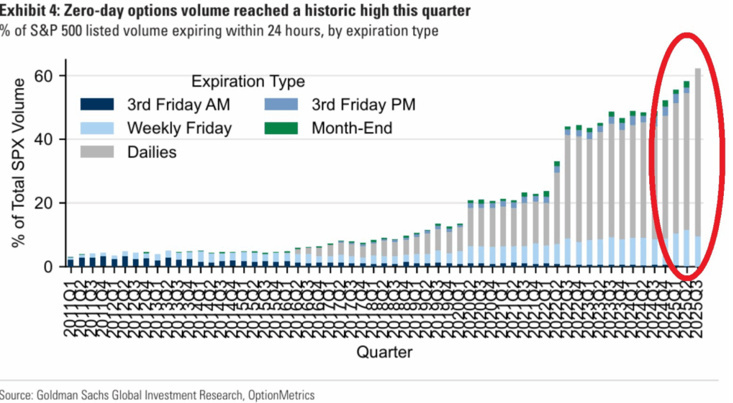
Call option speculation exploded after 2021. Retail traders, flush with stimulus and using commission-free platforms, flooded into short-dated options. Meme stocks like GameStop and AMC became playgrounds for leveraged bets. By 2022, weekly call volumes hit record highs. Traders were no longer buying stocks—they were buying upside. The mindset shifted from investing to gambling, with massive trades on zero-day options and triple-leveraged bets on short-term moves. A recent #BullBearReport noted this option explosion.
“Furthermore, options volumes at meme‑linked names are at records, with short-dated, zero-day-to-expiration (0DTE) contracts now accounting for more than 61 percent of daily S&P 500 option volume. Retail “meme market” investors are responsible for half to 60 percent of that. That sensation feels more like gambling than investing.”
(Click on image to enlarge)
This behavior distorted the market. Stocks with high call volume experienced unnatural rallies as dealers hedged exposure. Volatility surged, but not from fear, but from greed. This dynamic still shapes the tape today as call options remain a favorite tool for speculation. But notably, it isn’t just 0-DTE options but call options in general.
However, while many of those call options are speculators betting on upside returns, covered call writing has now become a “popular sport” for investors. To understand what is happening better, we must first understand what call options are and how they work.
- A call gives the buyer the right, but not the obligation, to purchase a stock at a specific price (the strike) by a certain date. The buyer pays a premium for that right. If the stock rises above the strike, the buyer profits. If not, the option expires worthless. The risk for the buyer is losing the premium (i.e., all your investment) while the reward is unlimited upside, minus the cost.
The other side of that trade is what is known as a “covered call.”
- In this case, the investor sells the call option on a stock they (the writer) already own. When the “writer” owns the underlying stock, the position is “covered,” hence the term “covered call.” In this case, the writer keeps the premium for selling the covered call, but agrees to sell the stock at the specific strike price agreed to.
In effect, covered calls monetize holdings in a portfolio. Investors who employ this option strategy keep the underlying stock and earn income from selling call option contracts against it. In other words, investors accept capped gains in exchange for current income. The risk to the strategy is that if the underlying stock rallies sharply, the upside is given up in exchange for the premium collected. However, if the stock price falls, the premium cushions the fall slightly, but does not protect the capital fully.
As opposed to outright call buying, covered calls are considered more conservative since they are a structured, rules-based tool designed to extract yield from existing equity exposure. They are typically suitable for long-term investors, income seekers, and anyone sitting on unrealized gains looking for a way to manage risk without selling. In today’s market, where speculation dominates headlines, covered calls offer a more sober way to use options as part of a real investment plan.
However, as is often the case, Wall Street is happy to monetize a strategy that has become popular. The problem is that the products offered may not be as lucrative as they are believed to be.
Enter Covered Call ETFs
Historically, covered call portfolios and strategies were a niche corner of the investment world. As in any market, scarcity provides value, whereas broad adoption dilutes the outcomes. Since 2021, as the surge in call options occurred, investors started seeking out every possible way to extract gains from the market. That search for yield in a high-valuation market has driven massive inflows into options-based strategies. As Wall Street saw demand increase for those strategies, and not wanting to “miss out,” they brought a variety of derivative-income ETFs to the market, which have now reached more than $150 billion in assets under management (AUM). These covered call-focused ETFs and SMAs are projected to grow from $2.75 trillion to $3.15 trillion this year.
Not surprisingly, retail and institutional investors are embracing the strategy, particularly as legacy holders of tech stocks, corporate insiders, and even hedge funds use covered calls to monetize stock positions without triggering immediate capital gains taxes. The income generated helps reduce portfolio volatility and boost returns in range-bound markets.
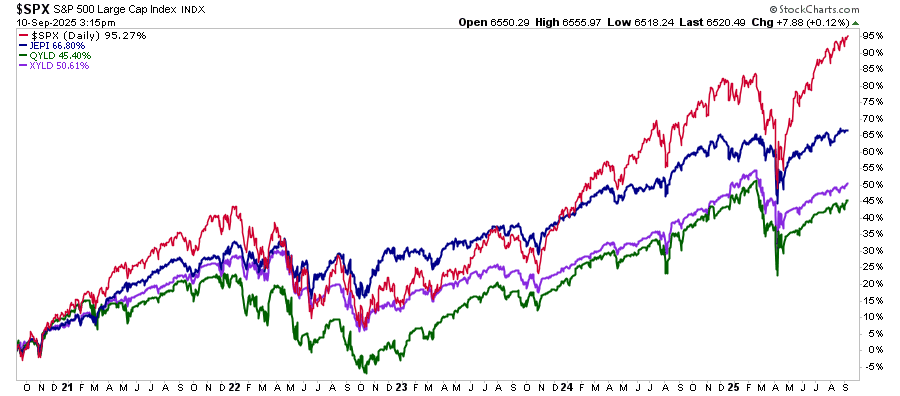
However, the attraction for retail investors has not been the tax efficiencies or income generation of covered calls, but the chase for high-yield alternatives. ETFs like JEPI, QYLD, and XYLD have seen explosive growth. JEPI’s portfolio uses equity exposure and equity-linked notes to distribute income near 10%. QYLD sells monthly calls on the Nasdaq-100 and yields above 12%. SPY targets the S&P 500 with a similar structure. With those yields, it is unsurprising that investors pour capital into these funds as bond yields stagnate and equity markets reach record highs.
However, are they getting a better return than just buying the S&P index? The chart below compares JEPI, QYLD, and XYLD to the S&P 500 Index regarding raw performance. In this case, the performance return includes dividends (dividends reinvested).
(Click on image to enlarge)
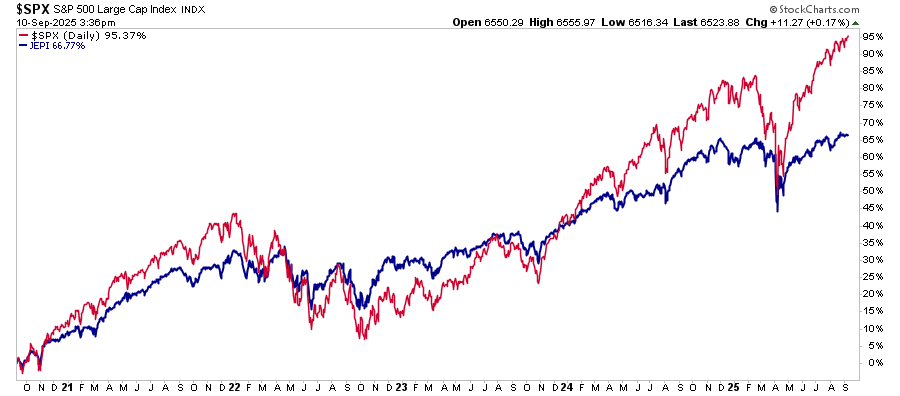
The following chart is the same analysis, but strips out the dividend to show the raw performance of the underlying holdings (dividends not reinvested.)
(Click on image to enlarge)

As the old saying goes, “there is no free lunch on Wall Street.”
What investors “THINK” will happen with a covered-call strategy on the S&P 500 is that they will get BOTH the performance of the S&P 500 and the 10-12% dividend yield. However, that is not the case, and investors would have been better off just by the S&P index instead.
In other words, the problem with covered call ETFs is that they are sold based on the “high yield,” which makes them more of a “psychological” investment rather than a sound one. Unsurprisingly, the market’s rally has created anxiety about high valuations, convincing investors who wanted to stay invested to chase yield. However, they have likely taken on more risk with these products than they have realized.
As is always the case, “risk” is not just about loss of capital but also about the loss of opportunity over the long run. While covered calls feel like a middle ground, providing yield without full exposure, the performance differential to outcomes can be significant. Critically, these products assume the market remains calm as these strategies rely on consistent volatility and low drawdowns. If either changes, the income evaporates, and prices can fall quickly, which cannot protect against the erosion of invested capital. Instead of helping, they can become a drag.
The chase for these ETF strategies has taken a once conservative investment strategy and turned it into a risk product. The risk today is that the high levels of complacency driving the current behavior have created a much more speculative outcome for investors, as the assumption is that nothing will go wrong.
Unfortunately, those assumptions are historically always wrong.
The Risk Of Covered Call ETFs That Aren’t Talked About
The demand for yield in a high-valuation market has turned a simple income strategy into something else entirely. What began as a conservative way to generate incremental returns is now packaged and sold as a high-yield product for anxious investors who want to stay in the market but fear the downside.
But, as discussed, there’s a disconnect between what investors think covered call ETFs will do and what they deliver. More importantly, these ETFs tend not only to lag during recoveries but can also fall sharply during the decline. The chart below looks at JEPI vs. SPY during the 2022 bear market. While the ETF fared slightly better than the market during the downturn, the significant lag during the recovery has created a 30% performance gap in recent years.
(Click on image to enlarge)
Investors have been sold the idea that these covered call strategies are the “holy grail” of investing. Over time, they do not keep up with pure equity exposure, underperforming in bull markets and lagging during sharp recoveries. More importantly, they fall in bear markets.
Yet investors keep buying them. Not because they’re seeking balance or diversification, but because they’re chasing yield. That’s no longer risk management. That’s speculation in disguise.
This complacency, the belief that volatility will remain low and income will remain stable, is the real danger. The moment that changes, these strategies turn from income generators into portfolio drags. Here’s how:
- Market corrections crush NAVs. Covered call ETFs remain long equities. When the market drops, they drop.
- Premiums disappear. In a real downturn, options pricing becomes chaotic. You don’t collect fat yields when volatility spikes for the wrong reasons.
- Calls cap the rebound. If the market recovers quickly, you miss the bounce. Your holdings get called away. You’re left watching from the sidelines.
- Liquidity becomes a problem. If flows reverse, fund managers must roll options or sell positions under pressure. That adds friction and potential forced selling.
- Behavioral traps emerge. Investors treat these products like bonds, then panic when losses arrive. They sell at the wrong time, locking in poor outcomes.
This is what happens when a defensive strategy becomes a high-yield sales pitch. When you chase income without understanding structure or risk, you’re not hedging. You’re gambling that nothing breaks.
But markets break. Always have. Always will.
The real risk here is not only capital loss. It’s the loss of opportunity. Read that again. Over time, capped upside reduces the market’s compounding properties. Therefore, even if you avoid the worst-case drawdowns, you still lag. The compounding drag of missing rallies can be as damaging as a steep decline.
The rise of covered call ETFs has created a psychological illusion, a sense of safety through yield. But safety is about preservation, not promises.
These products are sold for what they pay, not how they perform in real-world volatility. That disconnect will become evident during the next downturn, and when that happens, the same investors who sought comfort in covered calls may find themselves holding a product they no longer want, and one they never fully understood.
Wall Street has sold the “free lunch.” But when the bill comes due, the yield will not cover it.
Portfolio Tactics – What Really Matters
Covered call strategies can be valuable in portfolio construction. They generate consistent income, reduce short-term volatility, and manage concentrated stock positions. For long-term investors, especially those focused on income or tax efficiency, writing calls against existing holdings can be a smart way to monetize portfolio exposures without selling positions outright.
But covered calls are not a magic ticket to wealth. They do not eliminate risk, nor do they replace proper diversification. Furthermore, and most crucially, they certainly do not shield you from the full force of a broad market selloff. The premiums collected are usually too small in sharp drawdowns to provide meaningful protection. Worse, during strong market rallies, your upside is capped, leaving you behind if stocks surge beyond your selected strike prices.
The temptation to treat covered call ETFs as yield substitutes can also be dangerous. Many of these funds advertise double-digit yields, but those payouts often come at the cost of long-term capital growth. If you chase yield without understanding the trade-offs, you may collect income while losing purchasing power or underperforming the market.
To use covered call strategies effectively, you need discipline. You need clear rules and a process to align the strategy with your financial goals, risk tolerance, and market outlook. The following tactics offer a framework to help you stay in control, not just collect income:
- Use covered calls as income enhancers, not portfolio anchors. Allocate 10–20% of equity exposure, not 100%.
- Select strike prices above resistance. This gives room for price movement while generating a premium.
- Use ETFs for simplicity, but know what they hold. Look at yield source, option strategy, and exposure limits.
- Combine with put protection or cash hedges. A collar strategy can limit losses while preserving some upside.
- Monitor volatility regimes. If VIX spikes or premiums collapse, be ready to pause or adjust strategy.
- Don’t chase extreme yields. 15% yields often reflect high risk. Sustainable yield in covered call ETFs is closer to 6–9%.
- Be cautious with single-stock covered call ETFs. These are speculative and highly volatile.
- Use cash-secured puts as an entry strategy instead of buying shares outright in volatile names.
Yes, covered calls give you a way to extract yield, and they fit tactical portfolios in quiet markets. But you must control the risk. Don’t let a search for income blind you to the downside.
Stay disciplined. Manage expectations. Understand what you own.
(Click on image to enlarge)

More By This Author:
Corporate Earnings Slowdown Signaled By Employment DataOilfield Servicers Find New Hope In AI Power Demand
Oracle Puts The AI Infrastructure Trade Back In Action


Comments
Log in or sign up to join the conversation.