
Following futures positions of non-commercials are as of September 12, 2023.
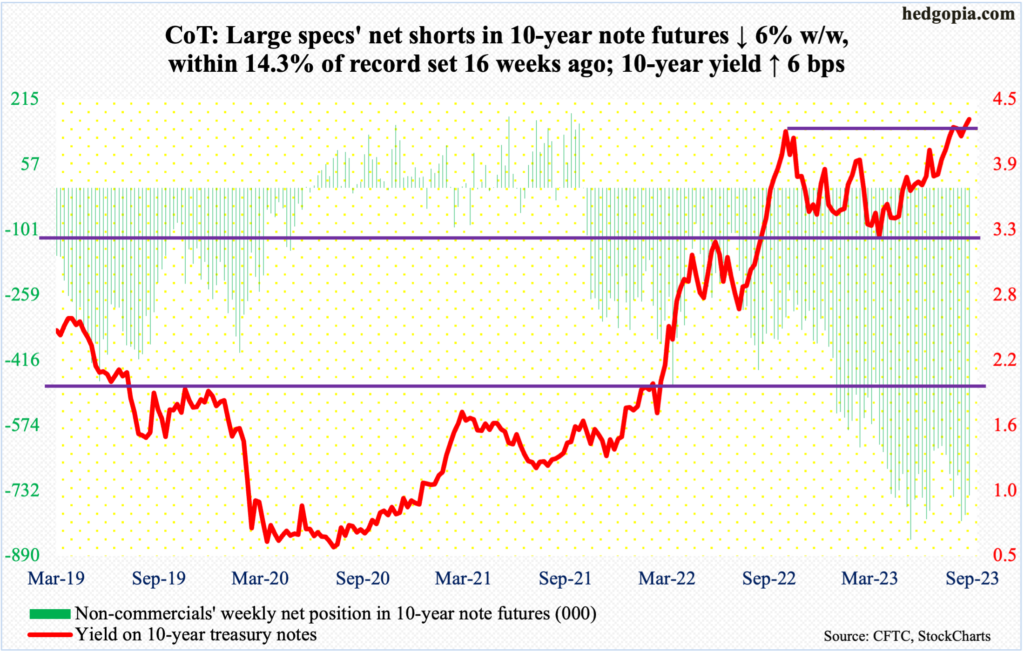
10-year note: Currently net short 744.3k, down 47.2k.
The FOMC meets next week. This is the sixth scheduled meeting this year, and two more remain – one each in October/November and December. Next week’s meeting comes with a summary of economic projections, so there will be a lot of information, including the dot plot.
The June dot plot was a lot more hawkish than expected, with 12 of 18 members expecting two more 25-basis-point hikes by December. The fed funds rate was raised in July. Next week, it is almost certain they will not move. Markets do not expect a hike either.
In the futures market, traders are betting with a 98-percent probability that the Federal Reserve next Wednesday leaves the benchmark rates unchanged at 525 basis points to 550 basis points. For the October/November meeting, the odds for a 25-basis-point increase go up to 27.1 percent, and to 34.4 percent in December.
More interesting is how these traders expect things to evolve next year. The Fed has made it amply clear that, given where inflation stands, rates would be left elevated longer than currently priced in. This will have repercussions for housing, for instance (more on this here). Futures traders, however, expect the central bank to begin easing next June, ending 2024 at 450 basis points to 475 basis points. As time passes, it is likely they will be forced to revise their rates outlook. As a matter of fact, they already have. Until just a couple of months ago, they expected the fed funds rate to end 2024 under four percent.
30-year bond: Currently net short 192.7k, down 5.6k.

Major US economic releases for next week are as follows:
The NAHB Housing Market Index (September) is scheduled for Monday. Homebuilder optimism declined six points month-over-month in August to 50. Last December’s 31 was the lowest since April 2020.
Housing starts (August) are due out Tuesday. Starts increased 3.9 percent m/m in July to a seasonally adjusted annual rate of 1.45 million units. January’s 1.34 million was the lowest since June 2020.
Existing home sales (August) will be out Thursday. July sales dropped 2.2 percent m/m to 4.07 million units (SAAR). From a year ago, sales were down 16.6 percent.
WTI crude oil: Currently net long 355.1k, up 26.2k.

The announcement last week by Saudi Arabia and Russia of voluntary production cuts of one million barrels per day and 300,000 b/d respectively for another three months until the end of this year is having the desired result.
This week, West Texas Intermediate crude rallied 2.9 percent to $90.02/barrel. Last week, it rose 2.3 percent, coming on the heels of a range breakout in the week before that. In the nine months before that, WTI was stuck between $71-$72 and $81-$82.
Non-commercials have been on the right side of this trade. By the week to June 27, they had reduced net longs to the lowest since February 2016. This Tuesday, holdings were the highest since March last year. The crude ticked $67.05 in June before rallying vigorously.
Understandably, the daily is overbought. At the same time, the weekly RSI, at 65.29, is yet to hit 70. Plus, there is decent resistance at $93-$94, and oil bulls will be tempted to ride the current momentum to go attack that level.
There is short-term support at $88.
In the meantime, as per the EIA, after three consecutive weeks of staying put at 12.8 mb/d, US crude production in the week to September 8 rose 100,000 b/d week-over-week to 12.9 mb/d, which is the highest since the week to April 17, 2020. Crude imports increased as well, up 812,000 b/d to 7.6 mb/d. As did stocks of crude, gasoline, and distillates, which respectively grew four million barrels, 5.6 million barrels and 3.9 million barrels to 420.6 million barrels, 220.3 million barrels and 122.5 million barrels. Refinery utilization was up six-tenths of a percentage point to 93.7 percent.
E-mini S&P 500: Currently net short 116.3k, down 27.9k.

At Thursday’s high, the S&P 500 was up 1.2 percent for the week. Come Friday, selling began right from the opening minutes, closing down 1.2 percent and ending the week down 0.2 percent; the session formed a bearish marubozu open candle, slicing through the 50-day moving average (4483).
The large cap index (4450) ended right at 4450s horizontal support. A breach – probable – opens the door toward breakout retest at 4320s.
This is taking place as non-commercials are fast running out of short positions to cover. As of Tuesday, net shorts in e-mini S&P 500 futures were at a 64-week low.
Mid-to long-term, buybacks are no longer as potent a tailwind as in the recent past (more on this here).
Euro: Currently net long 113.1k, down 23.2k.

Nine and counting. That is the number of weeks the euro has been down in a row. This week, it shed 0.3 percent to $1.0661.
The currency rallied from $0.9559 last September to $1.1270 on July 18 this year, before reversing.
This week, the European Central Bank surprised markets with a 25-basis-point hike to four percent. This marked a 10th consecutive increase in the benchmark deposit rate, which stood at minus 50 basis points when the tightening cycle began. There were hints that this was the last hike in this cycle, although ECB President Christine Lagarde would not commit to it.
The currency ended the week right at lateral support at $1.0650. Thursday, buyers showed up near the May low ($1.0635). Mid- to long-term, though, the path of least resistance is toward horizontal support at $1.03-$1.04.
Gold: Currently net long 123.9k, down 14.1k.

Gold bugs were not in a mood to lose the 200-day, which at $1,929 also coincides with crucial horizontal support at $1,920s. Thursday, the metal lost the average intraday tagging $1,922 but finished above by close. When it was all said and done, it closed the week up 0.2 percent to $1,946.
Gold remains rangebound. Bulls had a tremendous opportunity in May this year to stage a major breakout, but gold headed lower as soon as $2,085 was ticked on the 4th. In the past, $2,089 was tagged in August 2020 – an all-time high – and $2,079 in March 2022. Concurrently, gold bears have been unable to convincingly reclaim $1,920s.
The daily has room to rally. The 50-day is at $1,954, a takeout of which raises the odds the yellow metal rallies toward $1,980s, and subsequently toward $2,000.
Nasdaq 100 index (mini): Currently net long 9.1k, down 4.5k.

The monthly is turning lower. That is a long-term worry for tech bulls.
Immediately ahead, after remaining at/above the 50-day in the first four sessions, the average (15308) was lost on Friday, forming a bearish marubozu open candle. The Nasdaq 100 ended the week at 15202, down 0.5 percent.
The inability early this month to take out the July 19th high of 15932 established a pattern of lower highs. Last November, the index peaked at 16765, followed by a lower high of 16607 in December.
Right here and now, tech bears are probably eyeing last month’s low (14558).
Russell 2000 mini-index: Currently net short 63.6k, down 8.1k.

The Russell 2000 (1847) is back at testing the 200-day at 1846. Earlier, early this month, the small cap index failed at the 50-day (1913), which also formed the top end of a range between 1700 and 1900 in place since January last year.
A range breakout occurred on July 11 (this year). After that, the Russell 2000 went on to rally to 2004, which was hit on July 31, but came up short of eclipsing the February (2023) high of 2007. The downward pressure since found support at 1830s twice last month – on the 18th and 25th.
Wednesday, 1830s again found buyers, as the index tagged 1838 intraday, finishing the week at 1847.
Once the 200-day gives way, odds favor the index heads back toward the midpoint of the range – 1800 – than the top of the range.
US Dollar Index: Currently net long 6.1k, up 2.7k.

After eight up weeks in succession, the US dollar index edged lower 0.1 percent this week. That said, Thursday’s intraday drop to 104.20 was bought, closing the week out at 104.99.
Support at 103-104 goes back to at least December 2016. The level was reclaimed early this month. So long as this holds, dollar bulls should be able to eventually take out 105, which has been a roadblock the last eight sessions. Else, momentum could be weakening near term. The daily RSI, which was above 70 for at least a couple of sessions last week, fell back into low- to mid-60s this week.
VIX: Currently net short 39.3k, down 3.4k.

VIX maintained its streak of finding support just south of 13. On June 22 and July 27, the volatility index bottomed at 12.73 and 12.74 respectively. This week, it dropped to 12.79 intraday Thursday and to 12.68 on Friday, with the latter session finishing at 13.79.
This is setting up as an opportunity for the index to rally toward at least the 50-day (14.76) and, in the right circumstances, the 200-day (17.93).
Thanks for reading!
More By This Author:
S&P 500 Buybacks Down From Record $281bn In 1Q22
Homeowners Not Tapping Into Equity
CoT: Peek Into Future Thru Futures, Hedge Fund Positions - Sept. 10


Comments
Log in or sign up to join the conversation.