
Following futures positions of non-commercials are as of January 18, 2022.
10-year note: Currently net short 271.4k, down 72.4k.
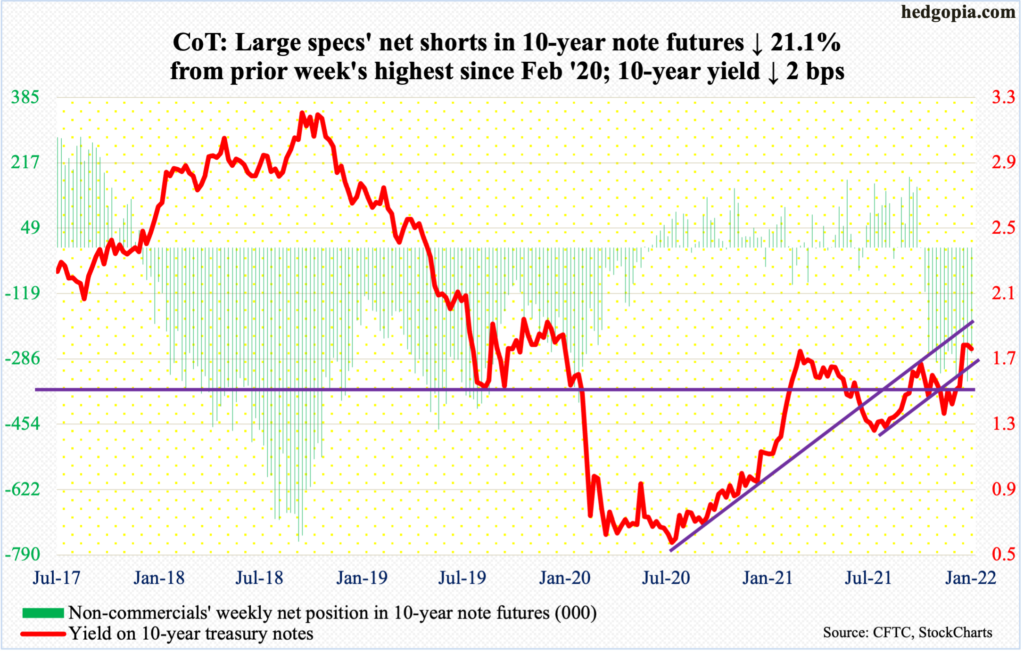
The FOMC meets next week. This will be the year’s first scheduled meeting, and seven more remain after this. Members will probably use this meeting to state that the first hike would take place in March. Futures traders have already priced that in. By the end of the year, they expect the fed funds rate to be in a range of 100 to 125 basis points, up from the current zero to 25 basis points.
Inflation is forcing the Fed’s hand. The latter is clearly playing catch-up. In the 12 months to December, the consumer price index surged seven percent; this was the steepest price rise since June 1982. Concurrently, December’s PCE (personal consumption expenditures) comes out on Friday; in the 12 months to November, the metric shot up 5.7 percent – highest since July 1982.
Markets are rapidly repricing everything. Last September, two-year treasury notes were yielding in the low-20s. Now, they yield just north of one percent. These rates tend to be the most sensitive to monetary policy expectations.
It is Monday-morning quarterbacking, but it is now becoming clear that the Fed overstayed its welcome with an aggressive monetary policy involving both quantitative easing and zero-bound rates, letting the inflation genie out of the bottle and allowing asset prices to run amok. Now comes the difficult part – that of bringing things under control without forcing the long end of the yield curve crying uncle in fear of massive slowdown in economic activity down the road.
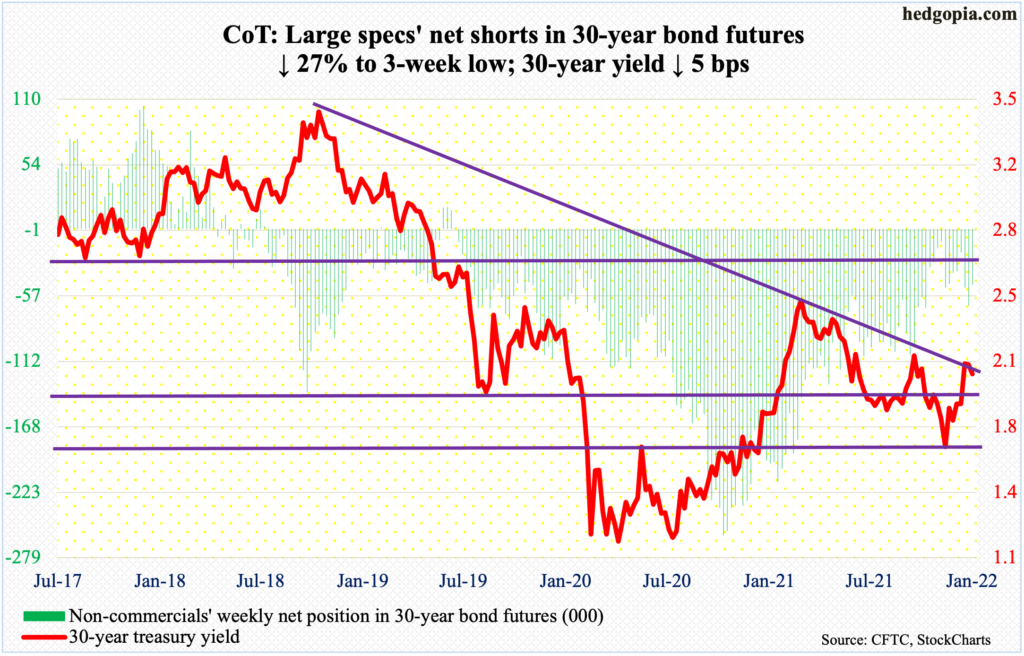
30-year bond: Currently net short 47.5k, down 17.5k.
Major economic releases for next week are as follows.
The S&P Case-Shiller home price index (November) will be published on Tuesday. Nationally, US home prices in October surged 19.1 percent year-over-year – slightly lower than August’s record 20 percent.
New home sales (December) are due out on Wednesday. November jumped 12.4 percent month-over-month to a seasonally adjusted annual rate of 744,000 units – a seven-month high. The median price of a new home rose two percent m/m in November to $416,900 – a new record.
On Thursday, GDP (4Q21, first estimate) and durable goods orders (December) are scheduled.
In 3Q, real GDP growth decelerated to 2.3 percent from 6.7 percent in 2Q. Growth is expected to snap back in 4Q, with the Atlanta Fed’s GDPNow model forecasting 5.1 percent rise.
November orders for non-defense capital goods ex-aircraft – proxy for business plans for capital expenditures – edged lower m/m from October’s record $78.8 billion (SAAR).
Friday brings personal income/spending (December), the employment cost index (4Q21) and the University of Michigan’s consumer sentiment index (January, final).
In the 12 months to November, core PCE, which is the Fed’s favorite measure of consumer inflation, jumped 4.7 percent. This was the steepest price rise since February 1989.
Private-industry total compensation increased 4.1 percent y/y in 3Q21. This was a two-decade high.
January’s preliminary reading showed consumer sentiment dropped 1.8 points m/m to 68.8 – barely above last November’s decade low 67.4.
WTI crude oil: Currently net long 394k, up 14.2k.
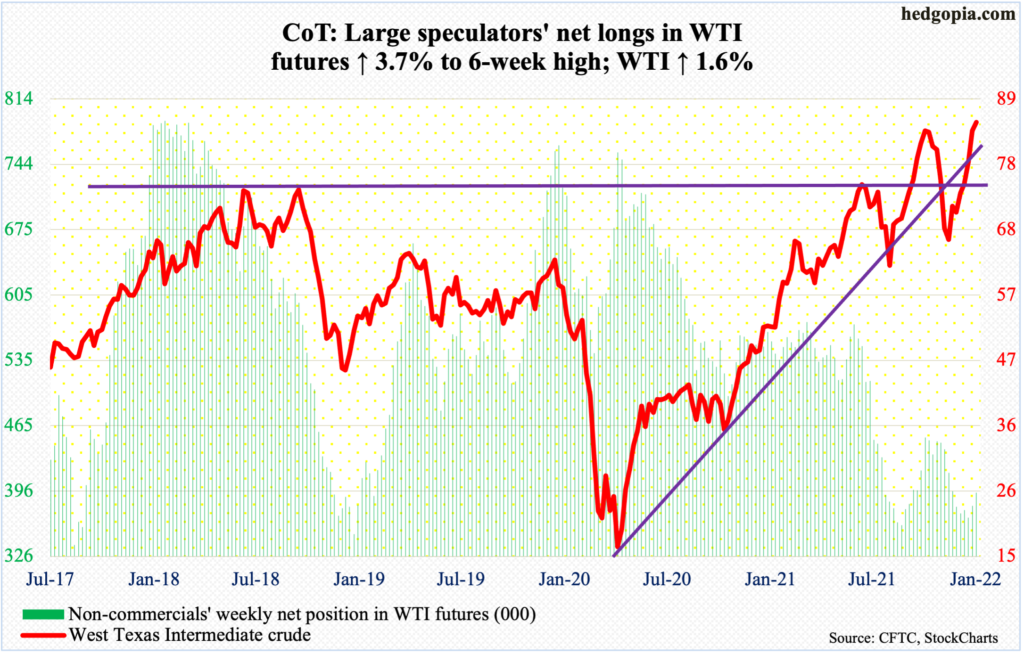
WTI ($85.14/barrel) edged past $85 resistance on Wednesday, but oil bulls were unable to hang on to all of the gains, with the session ending with a spinning top. Action on Thursday evolved similarly, as the crude ticked $87.10 intraday but closed at $85.55, producing a shooting star.
As recently as December 2, WTI traded at $62.43, so has come a long way. It remains grossly overbought on the daily. Despite this, momentum remains with the bulls, with shorter-term averages rising sharply. Friday’s low of $82.78 was bought at the 10-day.
Should $85 give way near term, there is horizontal support around $80, and $76-$77 after that.
In the meantime, US crude production in the week to January 14 was unchanged at 11.7 million barrels per day. Crude imports increased 676,000 b/d to 6.7 mb/d. As did stocks of crude and gasoline, which respectively rose 515,000 barrels and 5.9 million barrels to 413.8 million barrels and 246.6 million barrels. Distillate stocks, on the other hand, dropped 1.4 million barrels to 128 million barrels. Refinery utilization edged down three-tenths of a percentage point to 88.1 percent.
E-mini S&P 500: Currently net long 125.2k, up 47.8k.
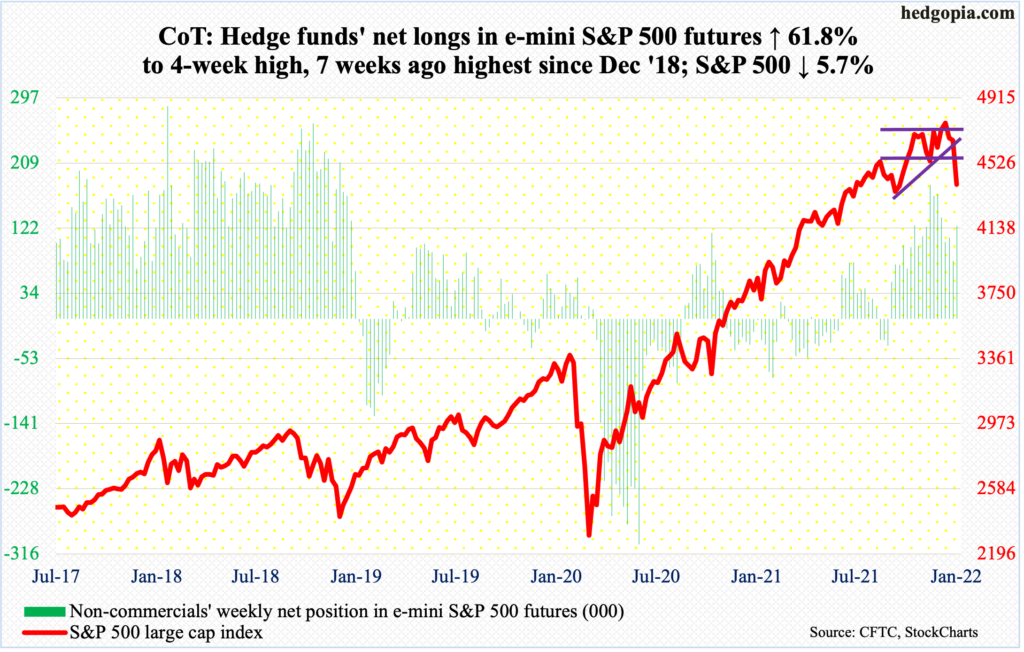
After attracting $56.2 billion over four weeks, US-based equity funds bled $2.4 billion in the week to Wednesday (courtesy of Lipper). In the same week, SPY (SPDR S&P 500 ETF), VOO (Vanguard S&P 500 ETF) and IVV (iShares Core S&P 500 ETF) lost $7.3 billion (courtesy of ETF.com).
Bulls hope this is not the beginning of a trend.
Elsewhere, FINRA margin debt declined $8.6 billion m/m in December to $910 billion. Earlier in November, it dropped $17.3 billion from October’s record $935.9 billion (chart here). In March 2020, this metric languished at $479.3 billion. A sustained drop in margin debt is not what the longs would want to hear at this point.
This is coming at a time when foreigners have been actively reducing exposure to US stocks. In the 12 months to November, their purchases totaled $94.9 billion, down substantially from record $405.5 billion posted in March (chart here).
January-to-date, the S&P 500 (4398) is down 7.7 percent. Last year, it rallied 26.9 percent. In March 2020, the large cap index bottomed at 2192 and peaked at 4819 on the 4th this month. There is a lot of optimism built into this surge, and given the interest rate outlook, investors are having to rerate their expectations.
In the last three sessions this week, intraday rally attempts were sold heavily. This is a slight change in investor attitude and a chink in the buy-the-dip armor. On Friday, the 200-day (4429) was breached, for a weekly bearish marubozu candle; this followed last week’s spinning top.
Nearest support lies at 4280s.
Euro: Currently net long 24.6k, up 18.6k.
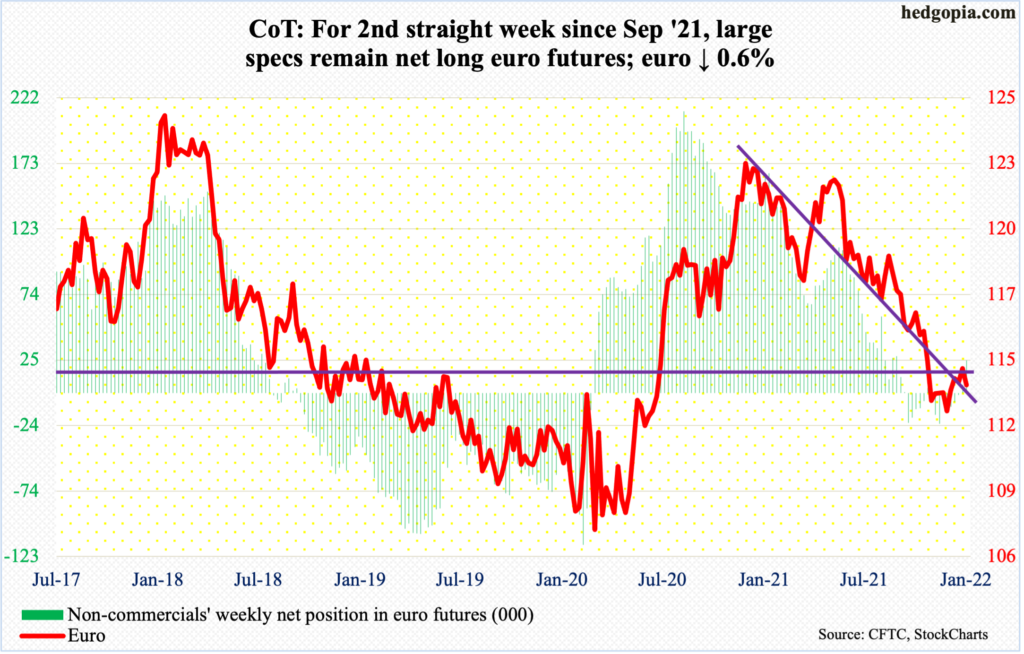
Last Thursday’s rejection just under $1.15 cost the euro ($1.1346) dearly. This week, the currency shed 0.6 percent, losing $1.14, which euro bulls had reclaimed last week after trying for seven weeks. This has proven to be an important level going back at least 18 years.
A rising trend line from November 24 gets tested at $1.13, which in fact did successfully occur on Thursday. A breach can embolden the shorts.
Gold: Currently net long 194.2k, down 5.5k.
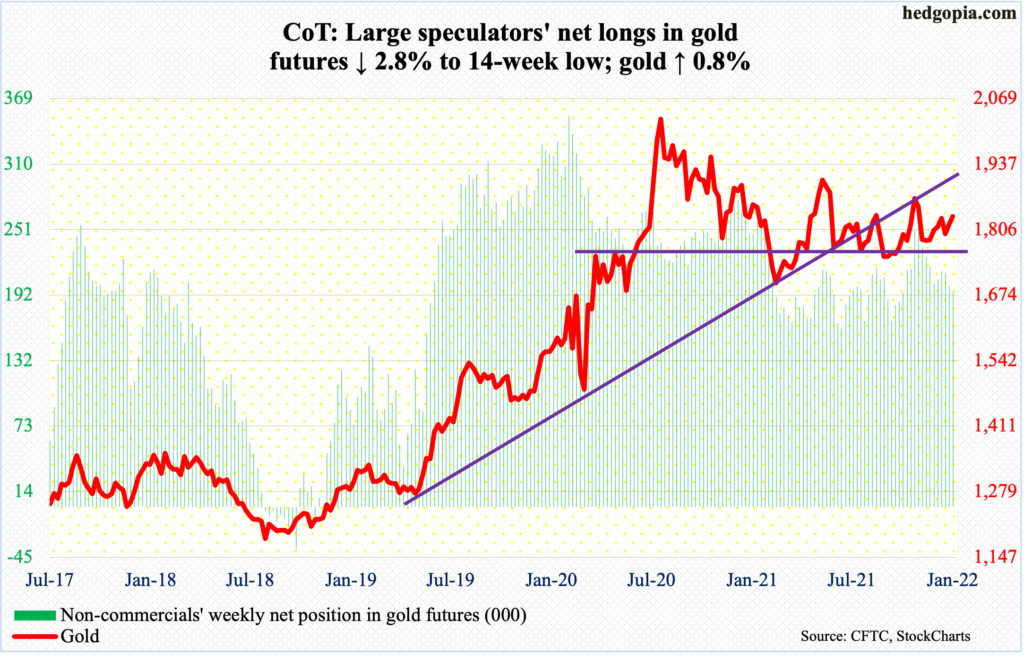
Wednesday’s 1.7-percent jump in gold ($1,832/ounce) sent the metal to a two-month high. It rallied further on Thursday, touching $1,849 intraday.
If gold bugs manage to defend $1,830s, which goes back more than a year, then $1,870s come into view; this will have also firmly established a pattern of higher highs, higher lows.
Nasdaq 100 index (mini): Currently net long 30.2k, up 8.9k.
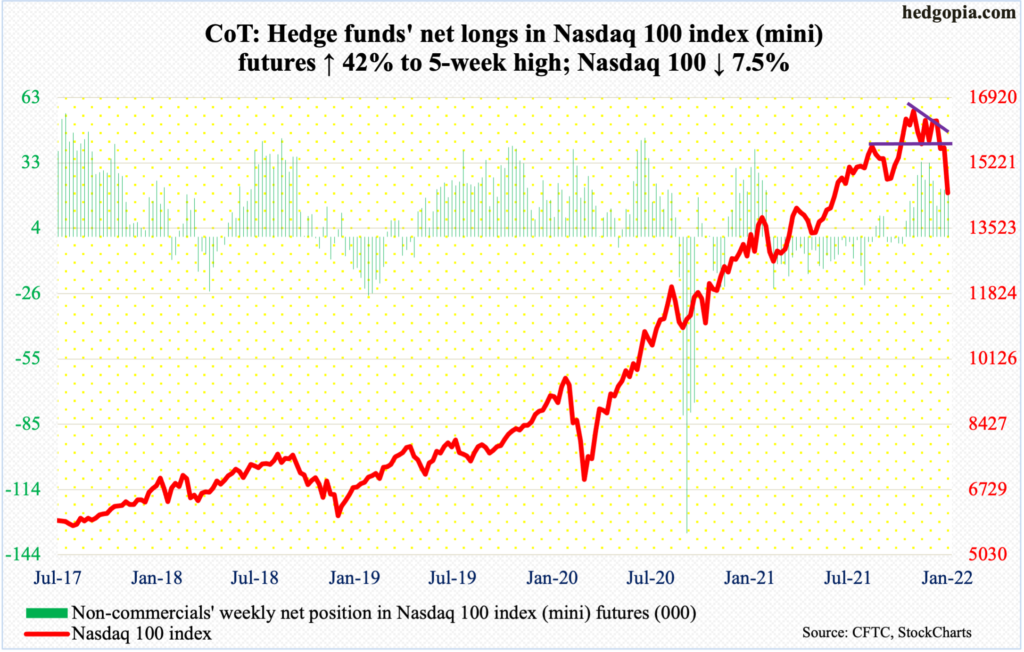
For the first time since April 2020, the Nasdaq 100 is in breach of its 200-day. The average (15003) was lost on Thursday, as was straight-line support at 15100s.
From the November 22 record high 16765 through Friday’s low, the tech-heavy index (14438) is down 13.9 percent. This week alone, it was punished for a 7.5 percent decline.
Medium- to long-term, more pain probably lies ahead for the bulls. Immediately ahead, there is horizontal support at 14000.
Russell 2000 mini-index: Currently net short 14.6k, up 9.3k.
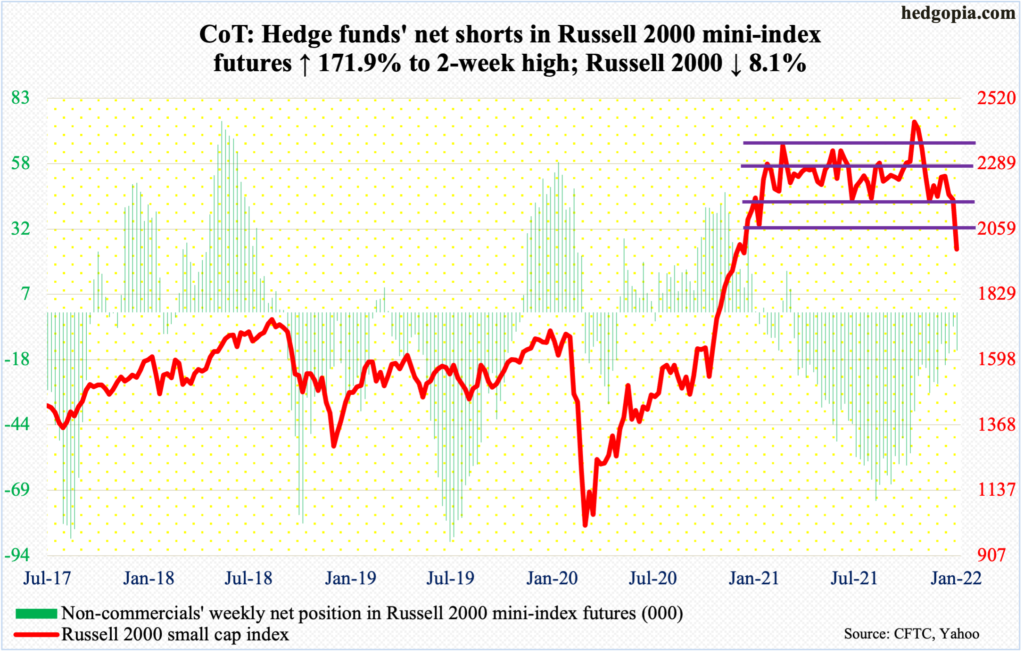
The Russell 2000 broke down this week. On Wednesday, the small cap index (1988) sliced through range support at 2080s, which is part of a months-long rectangle.
Since March last year, the Russell 2000 has been rangebound between 2350s and 2080s, and between 2280s and 2150s within this box. On Nov 3, it broke out but was quickly followed by a failed retest on the 19th.
Bulls hope this week’s breakdown is false similar to last November’s breakout. But odds are now heavily stacked against that. In due course, this week’s action has the potential to be a major breakdown.
US Dollar Index: Currently net long 36.4k, down 1.5k.
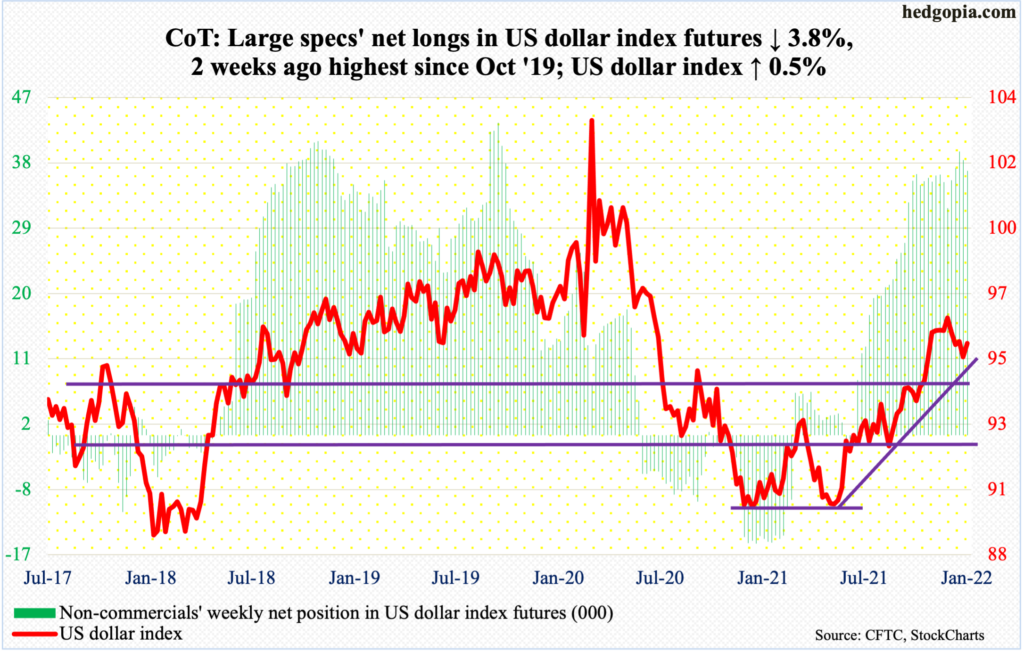
The test late last week of horizontal support at 94.50s is proving to be a success so far. This week, the US dollar index (95.64) rallied 0.5 percent, with Thursday’s intraday high of 95.85 testing the backside of a descending triangle, which it fell out of last week.
Should dollar bulls manage to reclaim 95.80s, their other test lies at 96.20s, which represents trend-line resistance from November 24 when the index tagged 96.94 before retreating. Horizontal resistance around 97 goes back at least 18 years.
VIX: Currently net short 46.9k, down 6.2k.
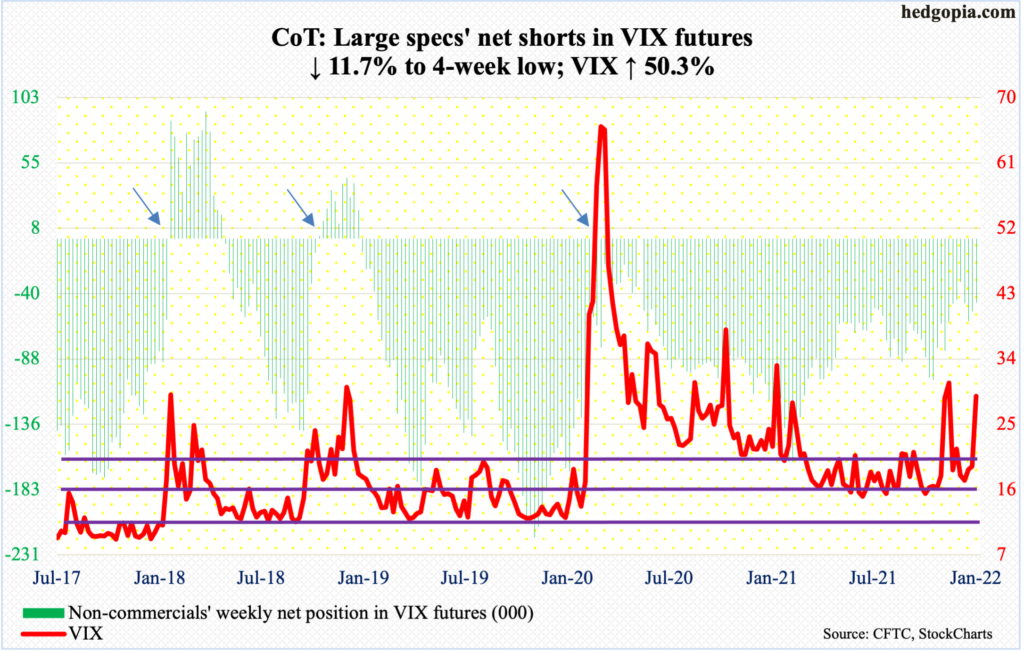
Two weeks ago, the daily MACD completed a bullish crossover, and continued higher this week. VIX showed strong momentum this week, rising to a one-and-a-half-month high on Friday, with the session holding on to most of the gains.
Given the move volatility has had in recent sessions, one should be on the watch for a spike reversal. In the past, once this occurs, VIX has shown a tendency to go the other way. This is yet to occur.


Comments
Log in or sign up to join the conversation.