
Following futures positions of non-commercials are as of September 10, 2024.
10-year note: Currently net short 1,022.1k, up 19.3k.
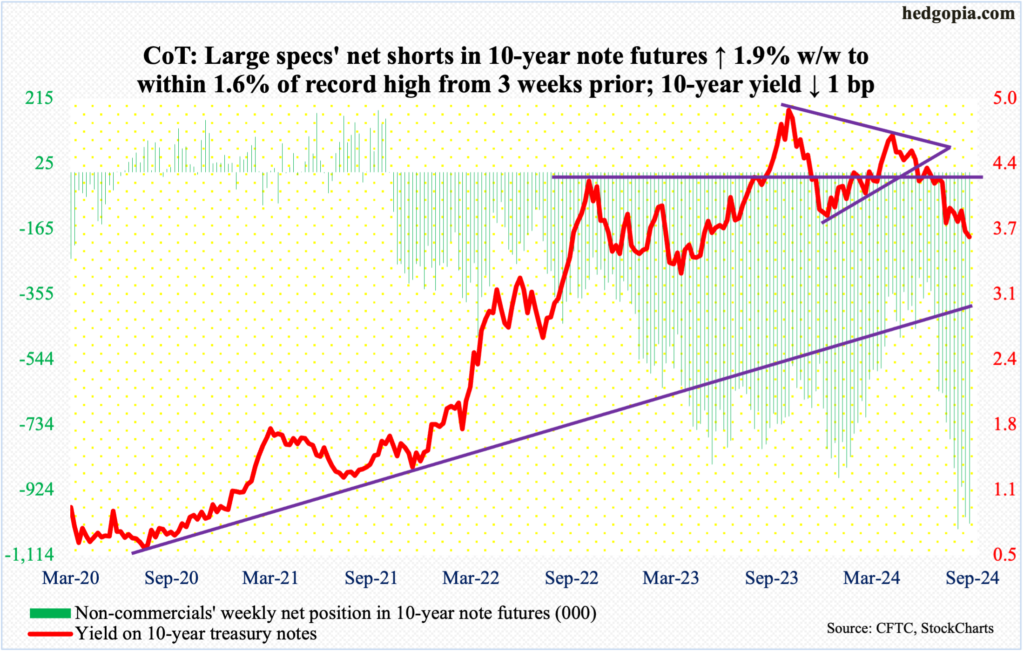
The FOMC begins a two-day meeting next Tuesday. This will be the sixth meeting this year, and two more remain – in November (6-7) and December (17-18).
The policy-setting body is due to begin an easing cycle. The fed funds rate has been left unchanged between 525 basis points and 550 basis points since July last year. Earlier, the Federal Reserve began to tighten in March 2022 after leaving the rates zero-bound in a range of zero to 25 basis points for two whole years.
Going into Wednesday’s CPI report for August, the odds of a 50-basis-point cut next week were about 55/45. Post-CPI, this changed to 85/15 for a 25-basis-point reduction. By the end of the week, futures traders were split right down the middle, meaning they were pricing in a 25 or 50 with equal probabilities.
The enigmatic end-of-the-week rise in the odds for a 50 is nothing but markets’ way of putting pressure on the Fed. Late last year/early this year, these traders were betting on six to seven 25-basis-point cuts this year. So much for that!
It is highly unlikely the Fed obliges these traders with a 50. They should not. Markets do what markets are supposed to do. Wall Street wants lower rates – always. After pricing in a 50, another 25 is expected in November, followed by a 50 in December. For next year, another 125 basis points of cuts are priced in, ending 2025 between 275 basis points and 300 basis points. The futures traders are demanding 250 basis points of cuts between this September and September next year!
In a scenario in which the FOMC acquiesces to these demands beginning with a 50-basis-point cut next week, this would nothing but signal urgency, and these things have a habit of acting as a self-fulfilling prophecy. Be careful what you wish for!
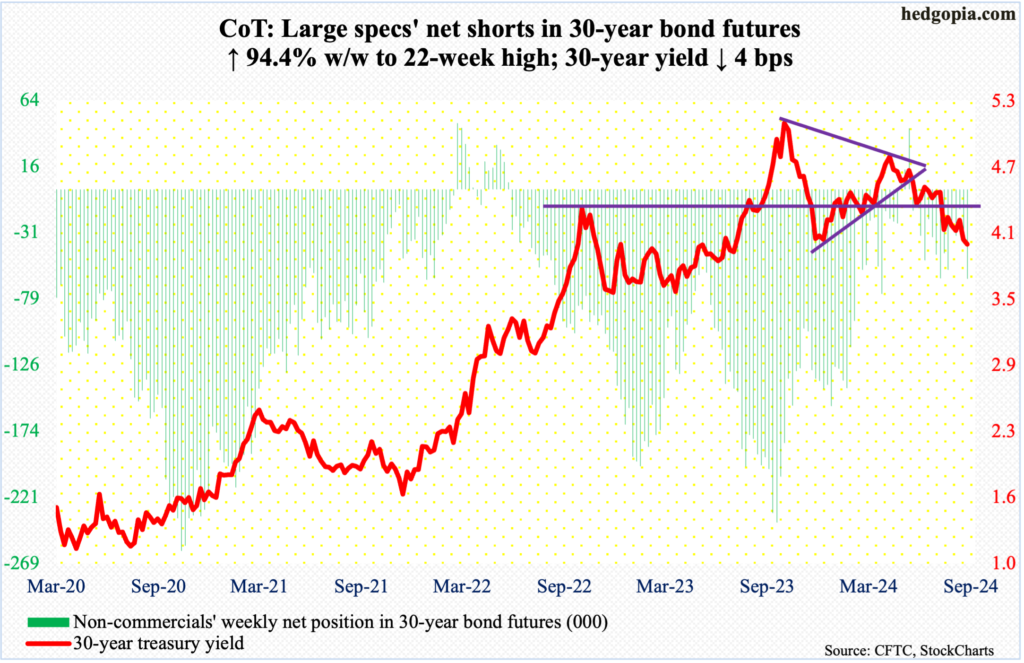
30-year bond: Currently net short 64.2k, up 31.2k.
Major US economic releases for next week are as follows.
Retail sales (August), industrial production (August) and the NAHB housing market index (September) are on schedule for Tuesday.
In July, retail sales jumped one percent month-over-month to a seasonally adjusted annual rate of $709.7 billion – a new record.
Capacity utilization dropped 0.7 percent m/m in July to 77.8 percent – a three-month low. January’s 77.2 percent was the lowest since April 2021.
Homebuilder optimism in August fell two points m/m to 39 – an eight-month low.
Wednesday brings housing starts (August). Starts tumbled 6.8 percent m/m in July to 1.24 million (SAAR). Starts have not been this low since May 2020. Last December, they reached 1.57 million.
Existing home sales (August) are due out Thursday. July sales increased 1.3 percent m/m to 3.95 million (SAAR) – a two-month high.
WTI crude oil: Currently net long 119.8k, down 36.8k.
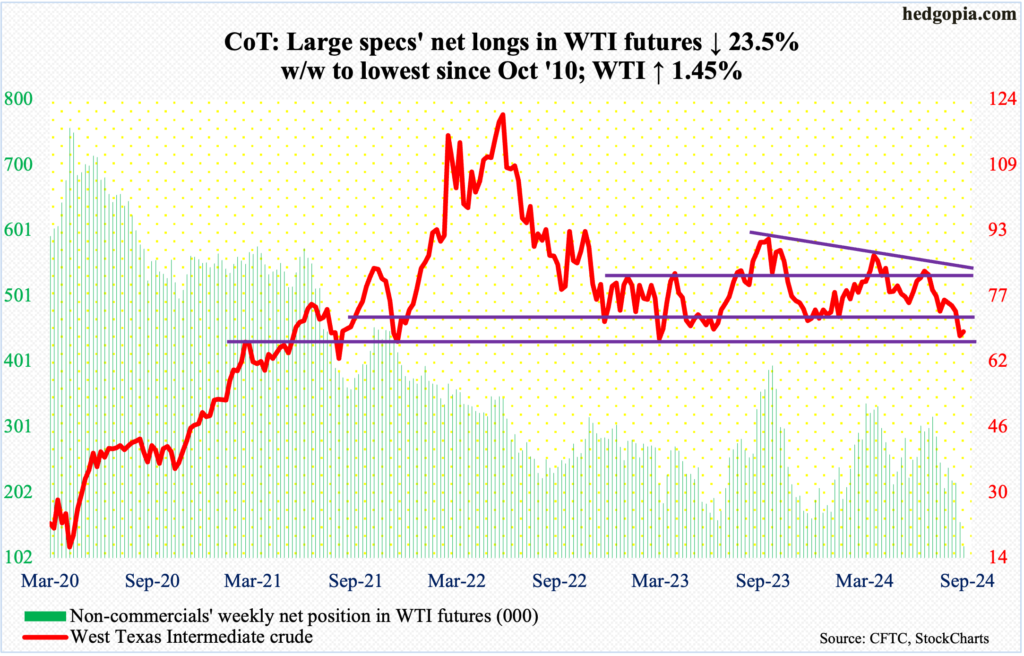
After four consecutive down weeks – and eight in nine – West Texas Intermediate crude rallied 1.45 percent this week to $68.65/barrel. Tuesday’s intraday low of $65.27 was the lowest since May last year when the crude bottomed at $63.57. Subsequently, it rallied all the way to $95.03 which was hit last September, before proceeding to establish lower highs in April and July this year. Last week, crucial support at $71-$72, which goes back nearly two decades and which also served as the bottom of a well-established range with the top at $81-$82, was breached. With this as a background, oil bears’ inability to take out the May 2023 low should be heartening for the bulls, not to mention this week’s weekly spinning top.
Ahead, oil bulls’ mettle will be tested at $71-$72. Sentiment remains very negative, with non-commercials having cut net longs to a 14-year low. Contrarians should like the sound of that.
In the meantime, US crude production in the week to September 6th was unchanged at 13.3 million barrels per day for three weeks in a row. In August, output hit a record 13.4 mb/d twice. Crude imports increased 1.1 mb/d week-over-week to 6.9 mb/d. As did stocks of crude, gasoline, and distillates, which respectively grew 833,000 barrels, 2.3 million barrels and 2.3 million barrels to 419.1 million barrels, 221.6 million barrels and 125 million barrels. Refinery utilization declined five-tenths of a percentage point to 92.8 percent.
E-mini S&P 500: Currently net short 59.4k, up 10.6k.
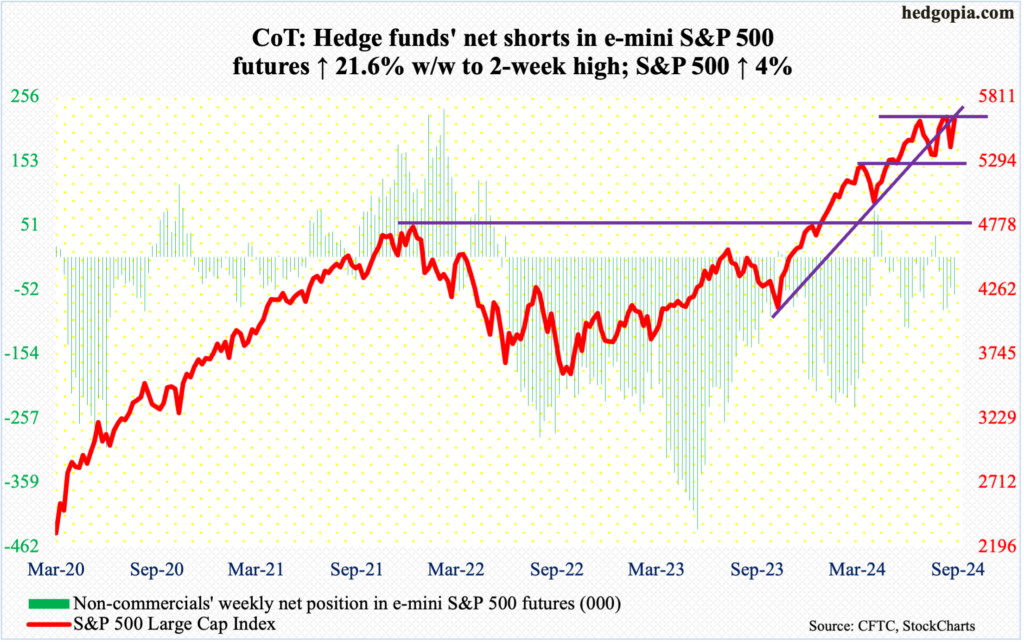
Equity bulls deserve kudos for how they acted this week.
Last week, the S&P 500 tumbled 4.25 percent, nearly all of which was wrested back this week. The large cap index jumped four percent to 5626 – just under 5640s-50s, where the bulls struggled twice in the last couple of months.
A breakout looks probable next week. The S&P 500 peaked at 5670 on July 16th.
Euro: Currently net long 81.4k, down 18.6k.
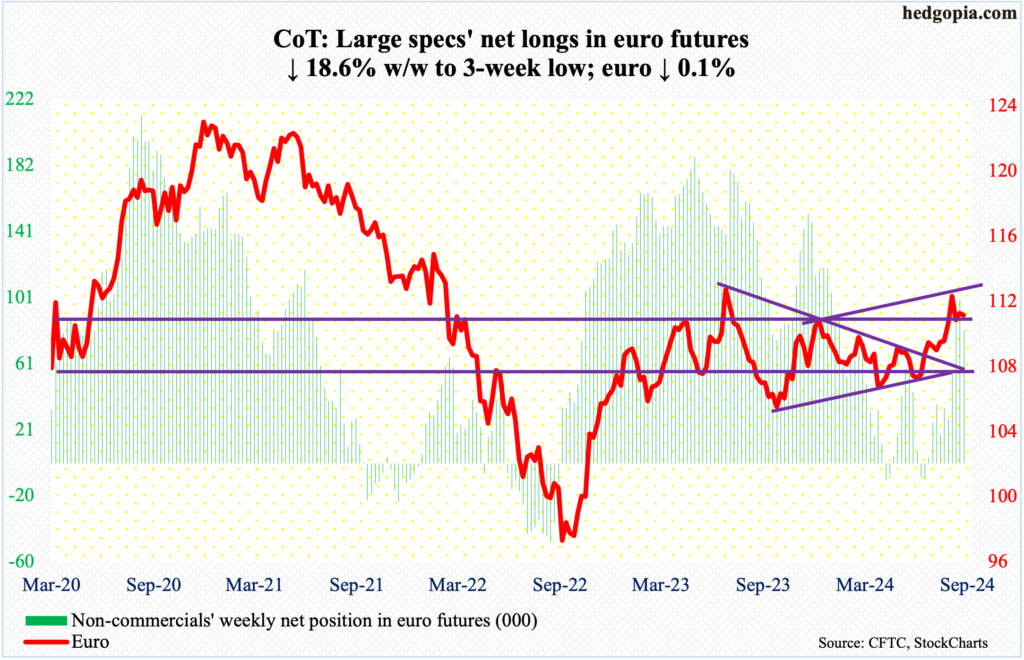
Euro bulls recaptured $1.10 four weeks ago but have been unable to meaningfully build on that. On August 26th, the currency tagged $1.1202 and reversed lower. This Wednesday, it touched $1.1002 intraday but did not breach that support, ending the week down 0.1 percent to $1.1076.
Amidst this, the weekly is turning lower, which probably means it is just a matter of time before the bulls lose $1.10. The euro is currently trading within a channel, with support at $1.08.
Gold: Currently net long 282.5k, down 5.1k.
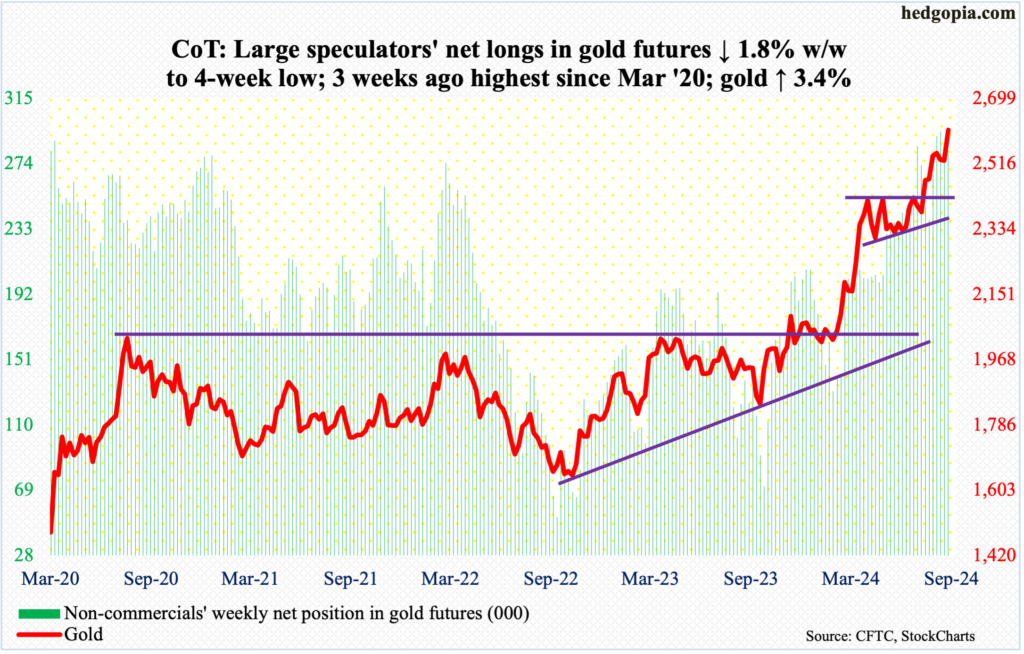
Gold bugs pulled off yet another superlative week. A series of unsuccessful attempts at $2,540s-50s since mid-August finally resolved favorably this Thursday when the metal broke out, followed by more strength on Friday. For the week, gold added 3.4 percent to $2,611/ounce.
This week’s move preceded a sustained rally from $2,305 this June, including an August breakout at $2,440s-50s after more than three months of sideways action.
Non-commercials, with net longs near four-and-a-half-year highs, remain committed.
Nasdaq (mini): Currently net long 25.6k, down 362.
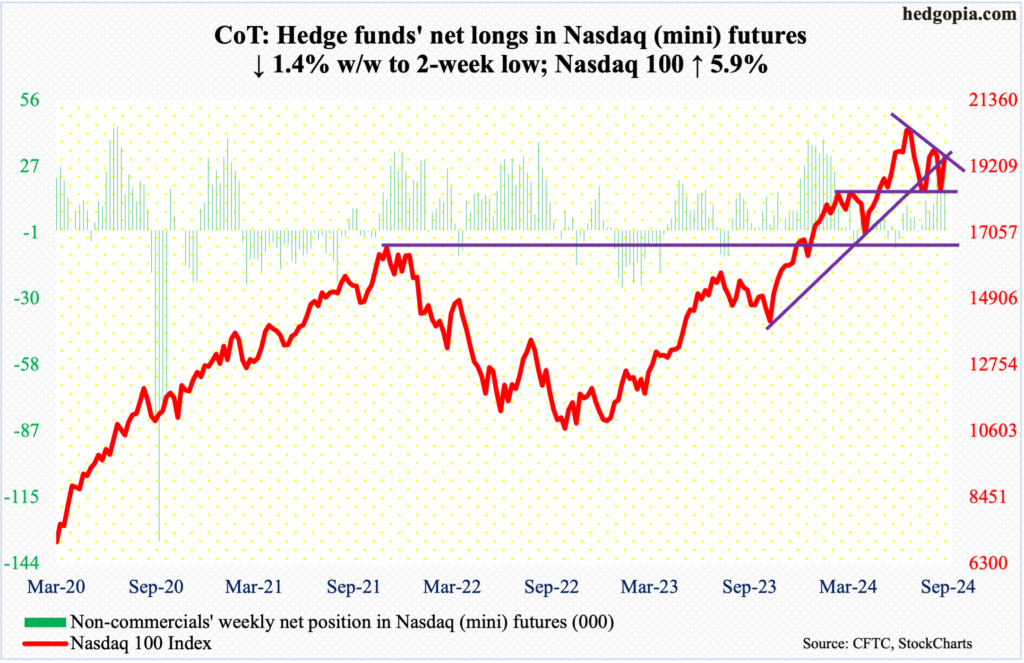
Last week, the Nasdaq 100 closed right on horizontal support at 18300s. The tech-heavy index had been on the back foot since peaking at 20691 on July 10th. This was an opportunity for tech bulls to demonstrate that the sector was not a lost cause, and they put their foot down.
This week, the index rallied 5.9 percent, erasing a loss of the same magnitude in the prior week. With this, the bulls are now looking at another opportunity. This week, the index closed at 19515, with Friday touching 19557 intraday, which kissed a falling trendline from the July high. A breakout here – likely – should open the door toward 19900s, followed by gap-down resistance at 20100-20300.
Russell 2000 mini-index: Currently net long 5.7k, up 5.5k.
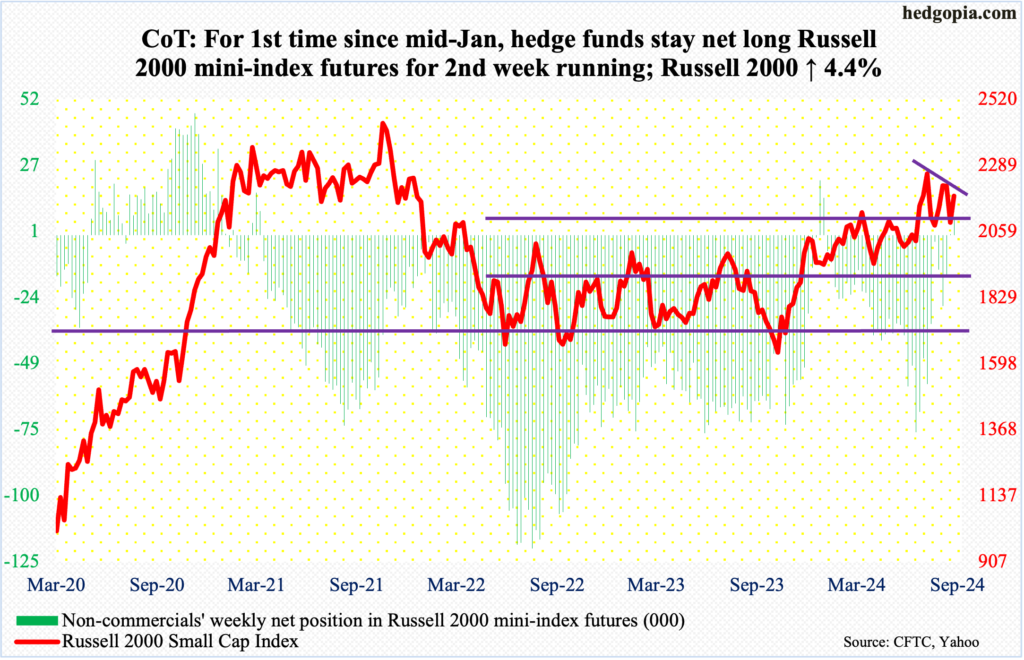
Small-cap bulls are looking at a similar technical setup as are the tech bulls. The Russell 2000 reversed hard on July 31st after ticking 2300 intraday. On the 11th that month, the small cap index broke out of 2100. This was preceded by a breakout at 1900 last December; earlier, it went back and forth between 1900 and 1700 beginning January 2022.
Since the July reversal at 2300, the Russell 2000 has dropped below and then back above 2100. This week, it rallied 4.4 percent to 2182, which sits just under a falling trendline from the July high. This represents an opportunity for the small-cap bulls to take out this resistance and hammer on lateral resistance at 2260s.
US Dollar Index: Currently net long 20.2k, up 781.
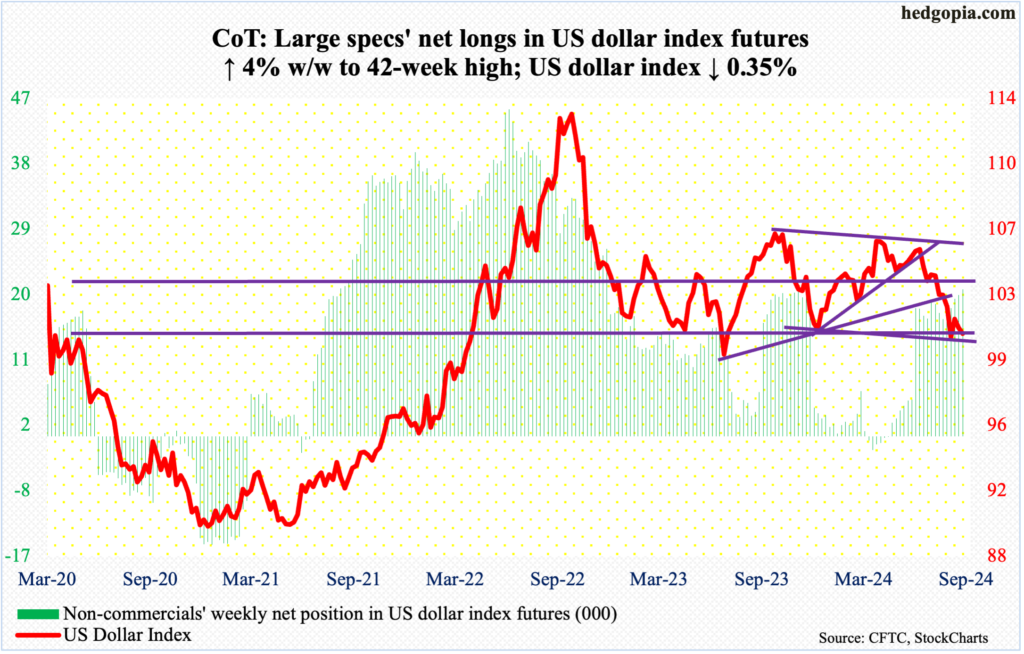
Dollar bears are threatening a breach of crucial horizontal support at 100-101, which goes back years. Friday, the US dollar index gapped down 0.6 percent to 100.79, although the session ended way off the intraday low of 100.53.
The index has essentially gone sideways just above 100 for four weeks now. It cannot afford a breach of this support.
In the event of a rally, the level to watch is 103-104, which goes back to December 2016. The support was lost early last month.
VIX: Currently net short 15.1k, down 10.8k.
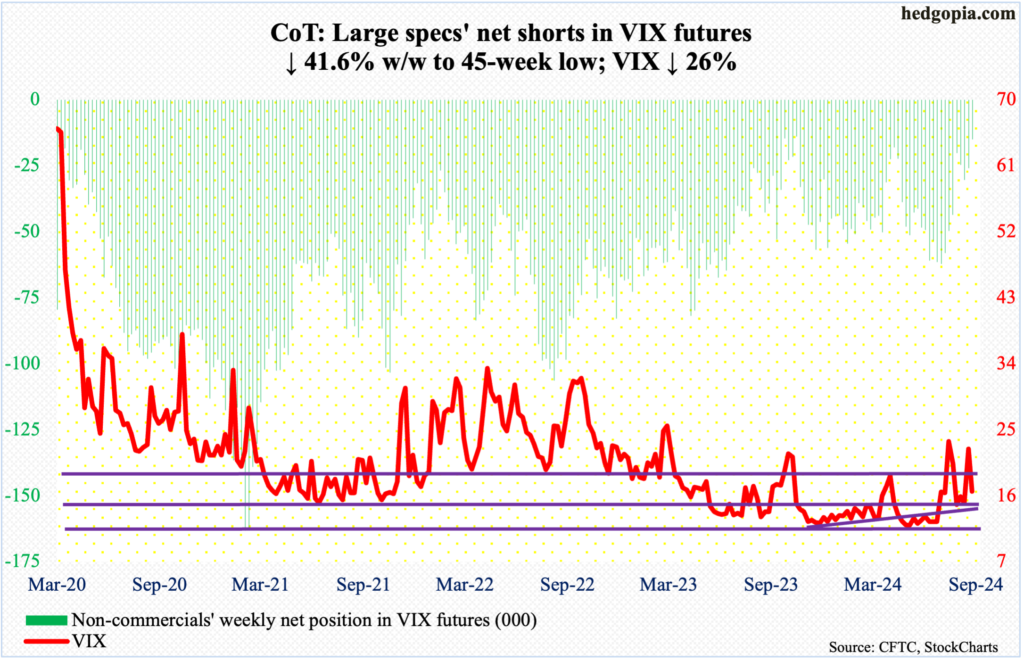
On Friday last week, VIX hit 23.76 intraday and retreated. This week, it fell in all five sessions, down 5.82 points for the week to 16.56 – under the 50-day moving average at 17.62 and above the 200-day at 14.65. The volatility index has not dropped below the 200-day for nearly two months now; but the average is nearly two points lower, meaning the downside risk is there if a test of the average were to occur.
Concurrently, non-commercials’ net shorts in VIX futures are now only 15,111 contracts – just above the October 31st low last year of 13,979 contracts. Back then, stocks reached an important bottom.
If past is prelude, VIX tends to peak once non-commercials either go net long or get close to doing that. This is music to the ears of volatility bears and/or equity bulls.
Thanks for reading!
More By This Author:
Futures Traders Expect 250 Basis Points Of Easing In Next 1 Year – Equities Not Buying ItEquity Longs Come Up Short, Fail To Exploit Decent Breakout Opportunity On S&P 500
Peeking Into The Future Through CoT Report: Futures, Noncommercial Buyers, How Hedge Funds Are Positioned


Comments
Log in or sign up to join the conversation.