
Following futures positions of non-commercials are as of August 3, 2021.
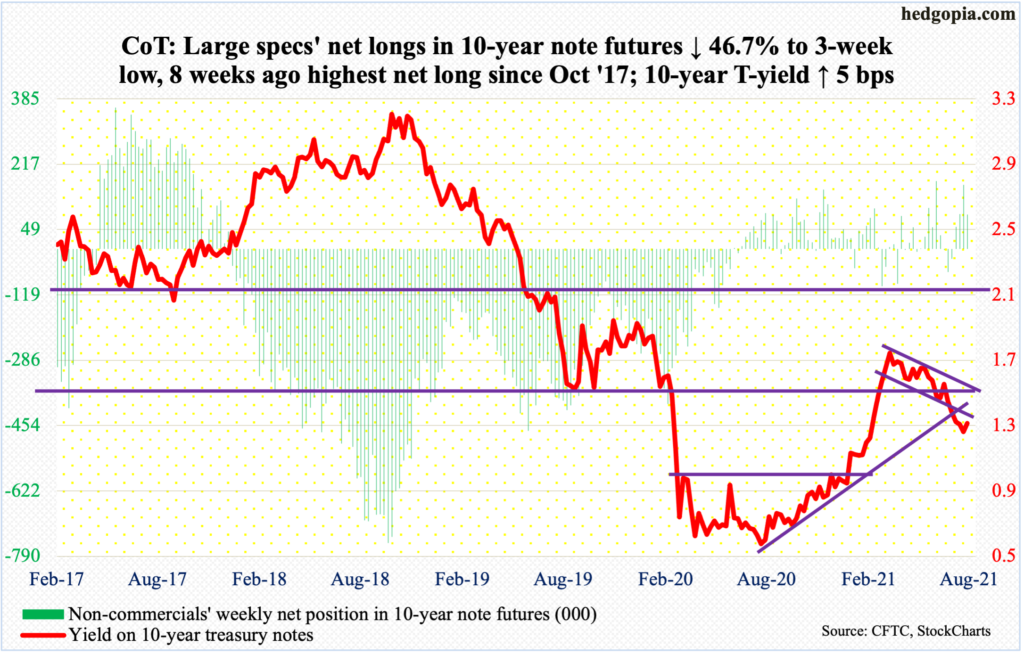
10-year note: Currently net long 87.7k, down 76.8k.
A total of 5.7 million and counting. That is the number of non-farm jobs needed to match the pre-pandemic high of 152.5 million from February last year. From the low of 130.2 million in April last year, 16.7 million have been created.
Last week’s FOMC statement said that progress has been made towards the economic goals the Fed hopes to achieve before slowing down its bond buying. Previously, it had said it wanted to see substantial progress.
The FOMC statement came before Friday’s report for July in which 943,000 non-farm jobs were created, coming on the heels of June’s 938,000. This gives more fuel to FOMC hawks arguing for tapering to begin.
Currently, the Fed buys up to $80 billion in treasury notes and bonds and $40 billion in mortgage-backed securities every month. The balance sheet has grown from $4.2 trillion in early March last year to $8.3 trillion.
Going by the vibes coming out of last week’s meeting, it is likely the Fed begins to slow down its bond purchases toward the end of the year. What is not clear is the magnitude of the reduction. What is also not clear is if it is focused on jobs or the unemployment rate (5.4 percent in July versus 3.5 percent in February last year), or both, or some other metrics such as black and Hispanic unemployment rates.
Regardless, 10-year treasury notes continue to attract bids. On Wednesday, rates ticked 1.13 percent intraday before reversing higher. On July 20, they reversed higher after tagging the same level. There was a major breakdown in early July as support at low-1.40s got breached.
On Friday, rates rallied seven basis points to essentially close at the 200-day moving average (1.29 percent). There is room for more strength. In two of the last three weeks, bullish hammers have appeared on the weekly. Breakdown retest at low-1.40s is possible in due course.
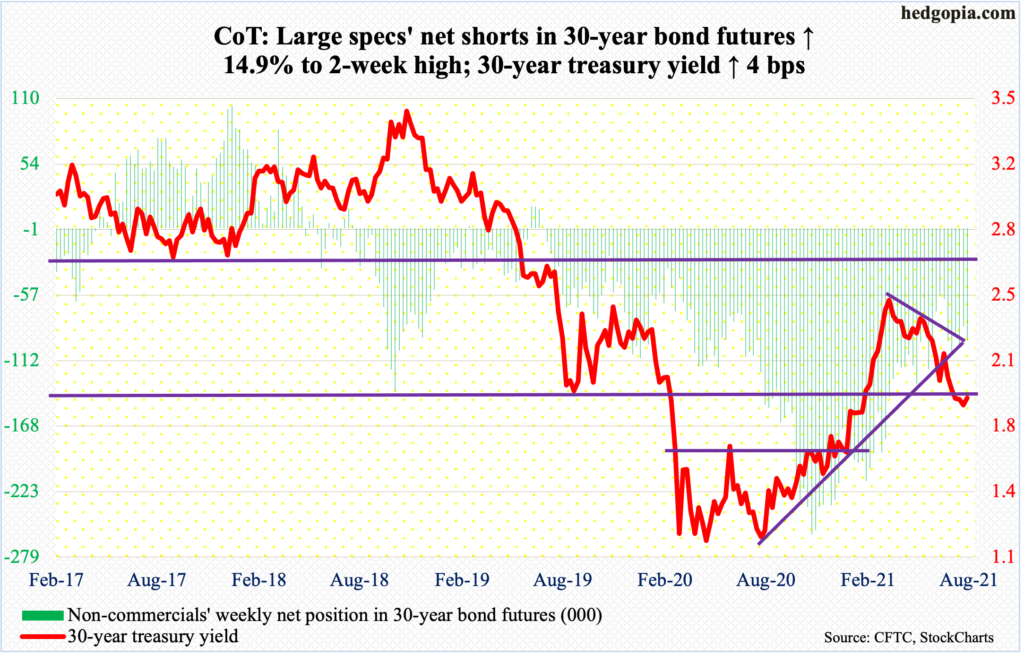
30-year bond: Currently net short 95.2k, up 12.3k.
Major economic releases for next week are as follows.
JOLTs job openings (June) come out on Monday. Openings in May rose 19,000 month-over-month to 9.2 million – a new record. The post-pandemic low of 4.6 million was set in April last year.
NFIB job openings (July) and productivity (2Q, preliminary) will be published on Tuesday.
Small-business job openings declined two points m/m in June to 46. In May last year, the sub-index languished at 23.
Non-farm output/hour in 1Q21 increased 4.1 percent year-over-year, which is the fastest pace in 11 years.
Wednesday brings the consumer price index (July). In the 12 months to June, headline and core CPI grew 5.3 percent and 4.5 percent – the steepest price rise since July 2008 and November 1991.
The producer price index (July) is on tap for Thursday. In June, PPI and core PPI rose one percent and 0.5 percent m/m. In the 12 months to June, producer prices increased 7.3 percent.
The University of Michigan’s consumer sentiment index (August, preliminary) is due out on Friday. In July, sentiment dropped 4.7 points m/m to 80.8 – a five-month low.
WTI crude oil: Currently net long 431.7k, down 14.6k.
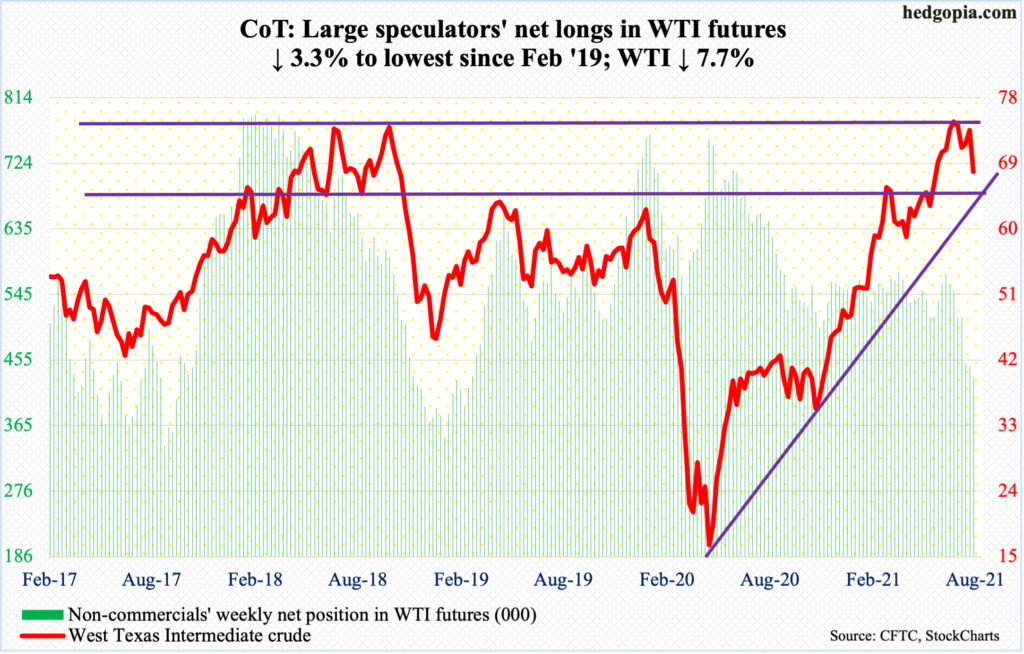
Support at $66-$67 was once again tested this week as WTI ($68.28/barrel) ticked $67.61 on Thursday before drawing bids; on Friday, it again touched $67.80 intraday. Earlier on July 20, the crude dropped to $65.01 before reversing higher.
The fact remains that last Friday’s $74.23 constitutes a lower high versus $76.98 posted on July 6. Bears are likely to get aggressive once $66-$67 gives way. Until then, choppy action is likely.
In the meantime, US crude production in the week to July 30 was unchanged at 11.2 million barrels per day. Stocks of crude and distillates rose by 3.6 million barrels and 832,000 barrels to 439.2 million barrels and 138.7 million barrels respectively. Gasoline stocks, however, fell – by 5.3 million barrels to 228.9 million barrels. As did crude imports, which were down 75,000 b/d to 6.4 mb/d. Refinery utilization inched up two-tenths of a percentage point to 91.3 percent.
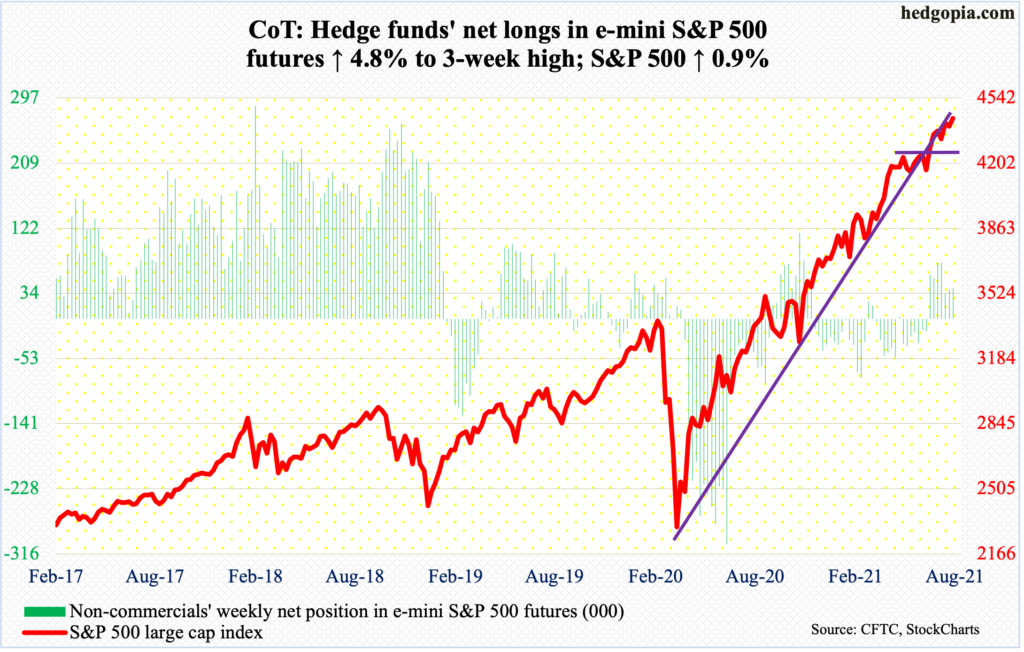
E-mini S&P 500: Currently net long 41.3k, up 1.9k.
US-based equity funds took in $2 billion in the week to Wednesday (courtesy of Lipper). In the same week, SPY (SPDR S&P 500 ETF), VOO (Vanguard S&P 500 ETF) and IVV (iShares Core S&P 500 ETF) gained $1.2 billion (courtesy of ETF.com).
In three of the five sessions this week, the S&P 500 closed at 4420s. On Friday, the large cap index (4437) eked out a breakout. Its equal-weight cousin, RSP (Invesco S&P 500 Equal Weight ETF), has already done so.
In a seasonally tough period, the question is of durability of the breakout. If it is enough just to set off stop loss and cause minor short squeeze, then a follow-through will probably not occur.
In that case, unwinding of the overbought conditions the S&P 500 finds itself in on nearly all timeframes is the path of least resistance. From May last year, bulls have repeatedly defended the 50-day, which is 2.9 percent away. The latest defense took place on July 19, which was the 9th one in nearly 15 months (more on this here). This is the one to watch.
Euro: Currently net long 38k, down 119.
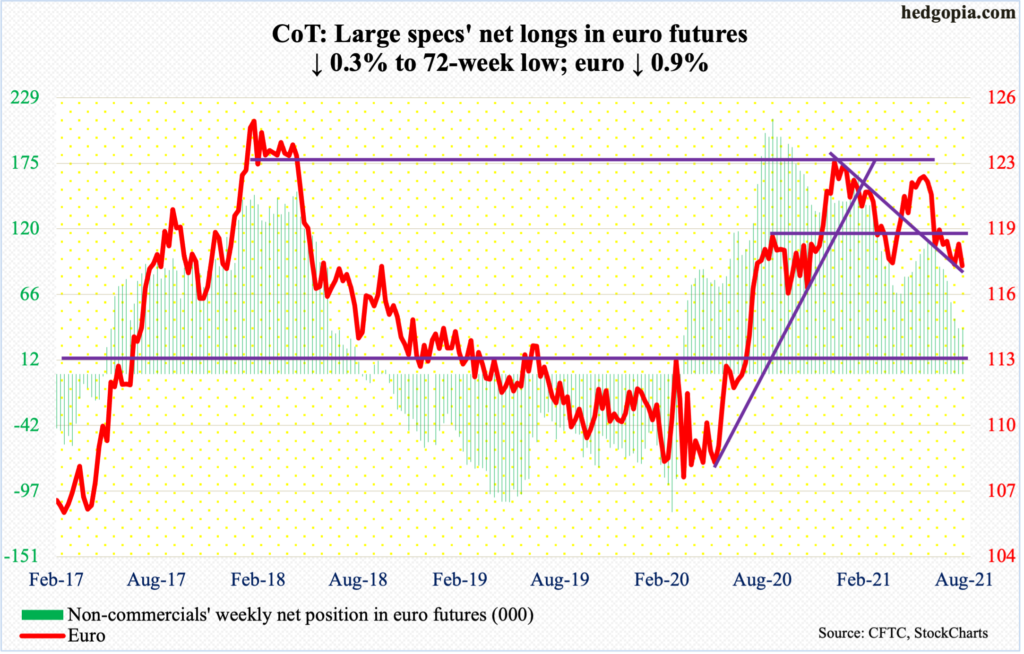
On the monthly, the MACD is on the verge a potentially bearish cross down. The same indicator on the weekly is itching to rally. Talk about a diverging message. That said, both timeframes could be right, with the difference being medium- and long-term.
Near term, for the second week running, the euro ($1.1764) faced resistance at $1.19. In the last week of June, $1.19-$1.20, which has proven to be an important level going back 18 years, repelled rally attempts several times. Most recently, this was breached on June 17.
At this juncture, the March 30 low of $1.1712 has taken on significance.
Gold: Currently net long 196.3k, down 3.1k.
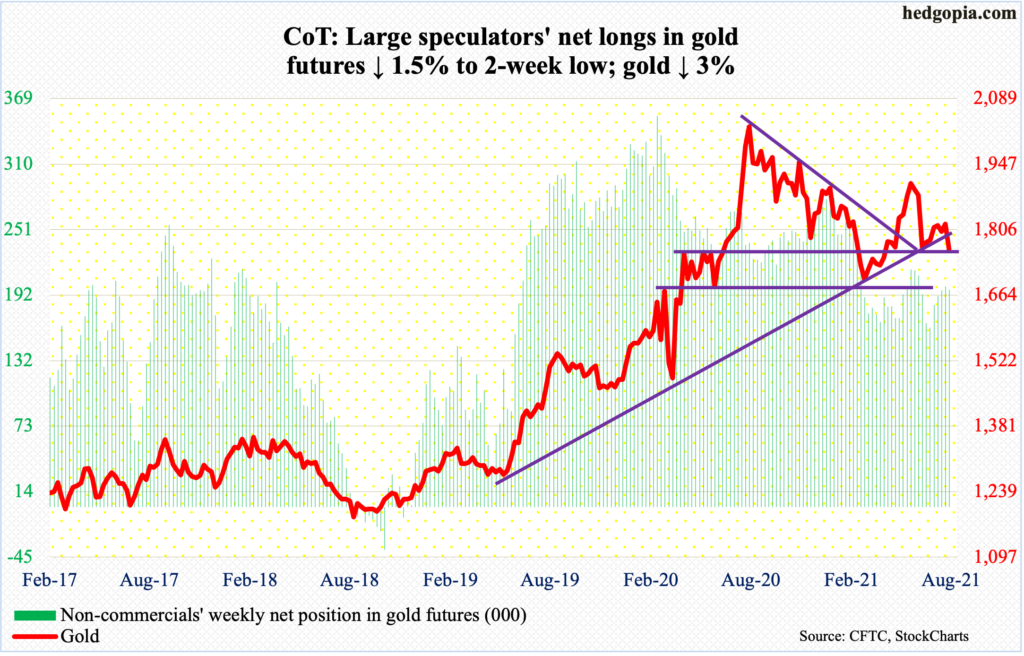
Gold ($1,763) is teetering on major support at $1,760s-70s, which was defended several times in the second half of June. On Friday, the metal tumbled 2.5 percent, slicing through support at $1,800.
Earlier, gold bugs faced real resistance at $1,830s. Wednesday’s intraday 1.2-percent rally to $1,836 was sold hard, with the session ending essentially unchanged.
Before Friday’s breakdown, the yellow metal essentially traded around the 50- and 200-day ($1,823 and $1,821 respectively) since mid-July. Resistance at $1,840s held.
A decisive break of $1,760s-70s opens the door toward $1,670s.
Nasdaq 100 index (mini): Currently net short 1.5k, down 8.4k.
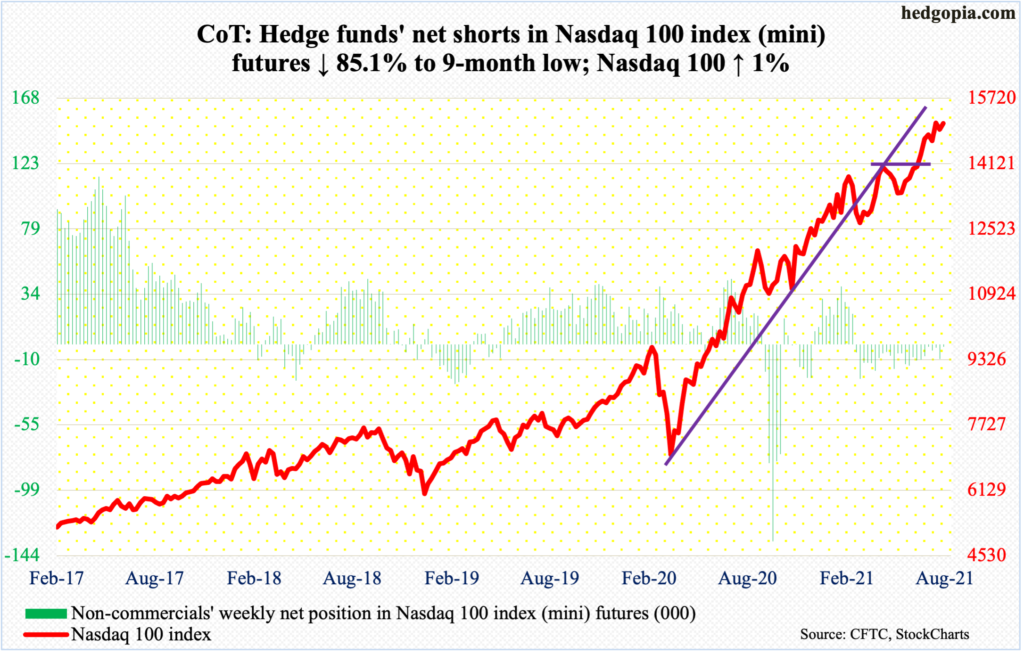
The same way the S&P 500’s equal-weight cousin broke out before its market cap-weighted version could, the Nasdaq 100 Equal Weighted Index broke out three weeks ago (more on this here), with an additional 0.6-percent gain this week. The Nasdaq 100 (15109) – the market cap-weighted index – rallied one percent this week and is trying to break out. This week, it broke out of a two-week pennant but is yet to bust out of horizontal resistance at 15100s.
Regardless, tech bulls defended the 20-day on Tuesday. This follows a similar defense of the average a week ago. Trend remains up. Seasonally, the next several weeks can pose problems for the bulls, but for this to develop into something nasty, momentum needs to reverse, and this is yet to happen.
Immediately ahead, 15000 has horizontal support, with the 20-day at 14940 gaining significance.
Russell 2000 mini-index: Currently net short 59.2k, up 2.4k.
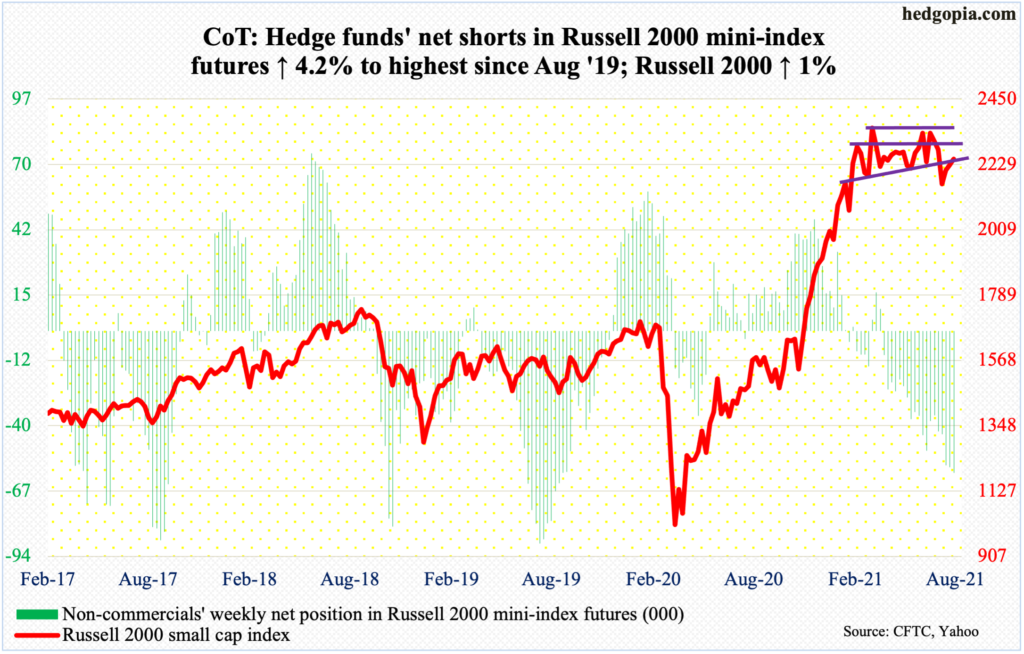
The Russell 2000 continues to trade water within a well-established, five-month rectangle. The small cap index (2248) has been playing ping pong between 2350s and 2080s. Before the upper bound is tested, there is straight-line resistance at 2280s.
On Friday, the index rallied as high as 2258, which just fell short of the 50-day, and was rejected. The last time it closed above the average, which is now flattish, was on July 12, so has been a while.
US Dollar Index: Currently net long 18.9k, up 2.3k.
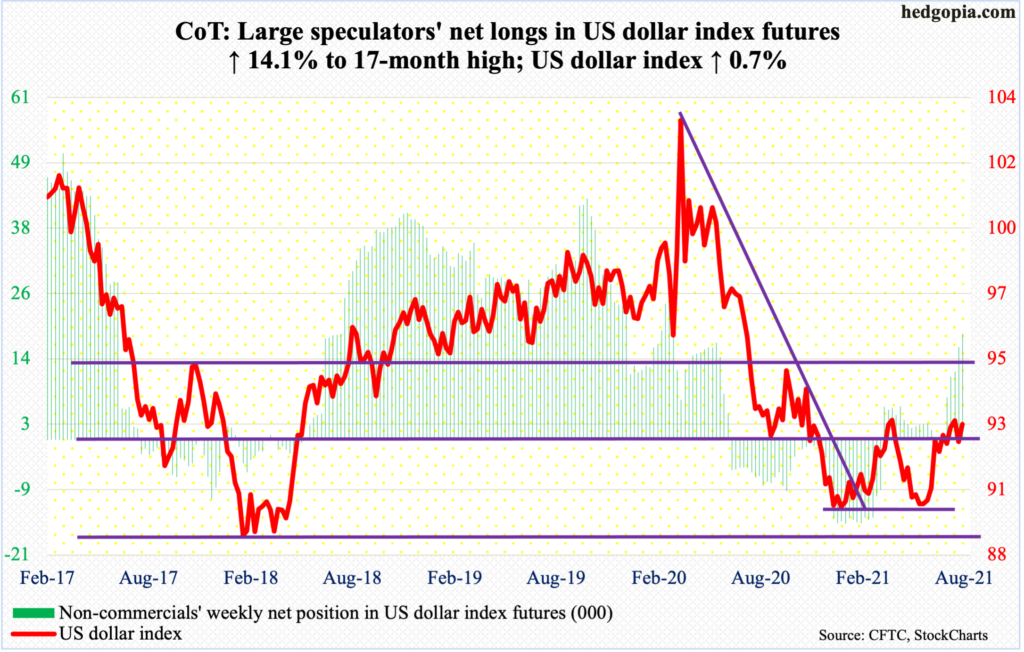
The US dollar index (92.80) is caught between the weekly and monthly. On the latter, there is plenty of room to rally; should the former win out, the index goes lower.
Non-commercials are leaning bullish.
This week, in the first three sessions the index fell just below 92 but only to attract bids. This probably set the foundation for Friday’s 0.6-percent rise.
The daily can rally. It will be interesting to watch what happens at 93, where a reversal will establish a pattern of lower highs, with the first two being 93.47 on March 31 and 93.20 on July 21.
VIX: Currently net short 56.6k, up 4.5k.
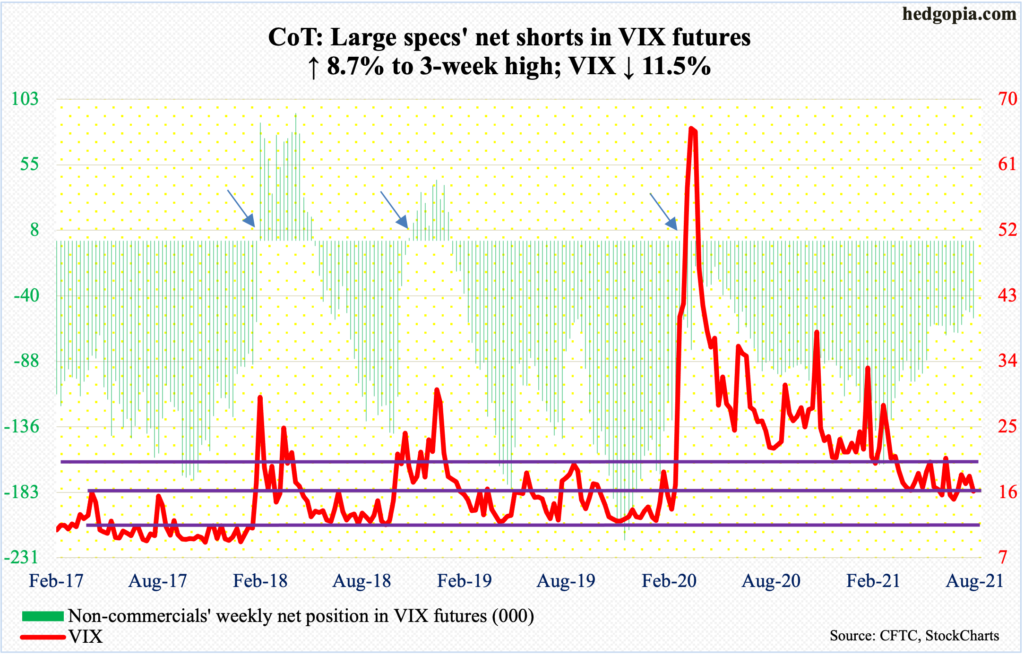
A rising trend line from late June/early July was breached on Thursday. Earlier on Tuesday, low-20s resistance was unsuccessfully tested as the session high tagged 20.44, before reversing lower. In the end, VIX closed out the week at 16.15.
Concurrently, the weekly RSI retreated from the median. Near term, this offers volatility bears an opportunity to push VIX lower – toward, in a worse-case scenario, 14-15. The daily lower Bollinger band is at 15.17.


Comments
Log in or sign up to join the conversation.