
Following futures positions of non-commercials are as of January 28, 2025.
10-year note: Currently net short 700.6k, up 120.4k.
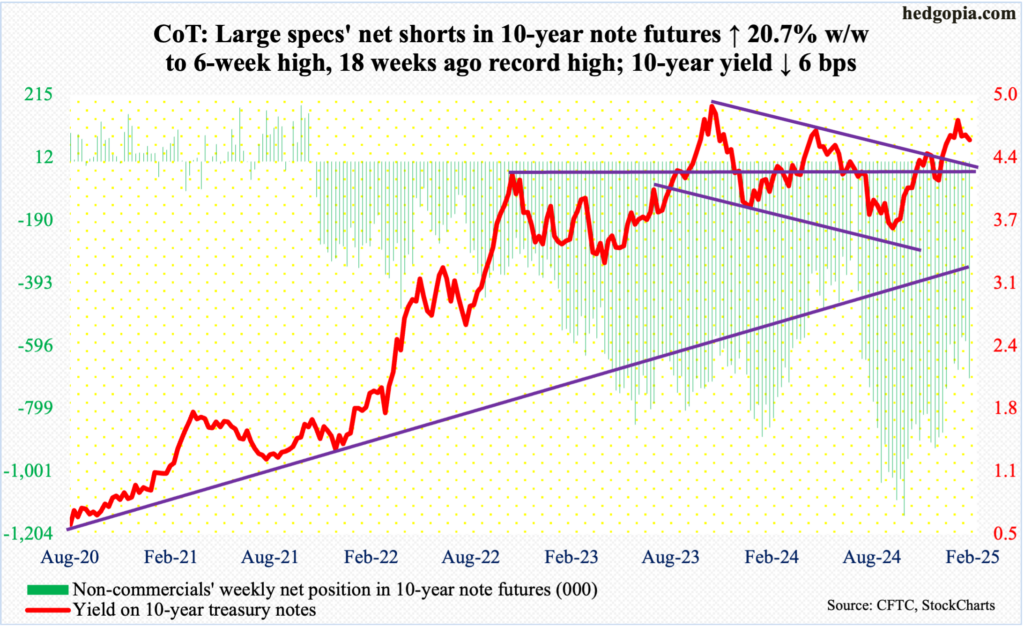
As expected, the FOMC this week left the fed funds rate unchanged at a range of 425 basis points to 450 basis points.
The benchmark rates are 100 basis points lower than the cycle-high range of 525 basis points to 550 basis points. There was a time markets were expecting the Federal Reserve to aggressively lower the rates this year. Now, they expect two 25-basis-point cuts in the remaining seven meetings this year. The way the economy is progressing, it is entirely possible the policy-setting body will not oblige.
Not surprisingly, both the FOMC statement and Chair Jerome Powell at a post-meeting press conference were noncommittal about the outlook for interest rates.
Besides the fact that the economy is holding up well and that consumer inflation is proving sticky above the Fed’s two percent goal, the central bank simply does not have enough information to model the pros and cons of the fiscal and tariff policies under the new Administration. It is a wait and watch for the central bankers as well as the markets. If anything, the risk going forward is renewed strength in inflation.
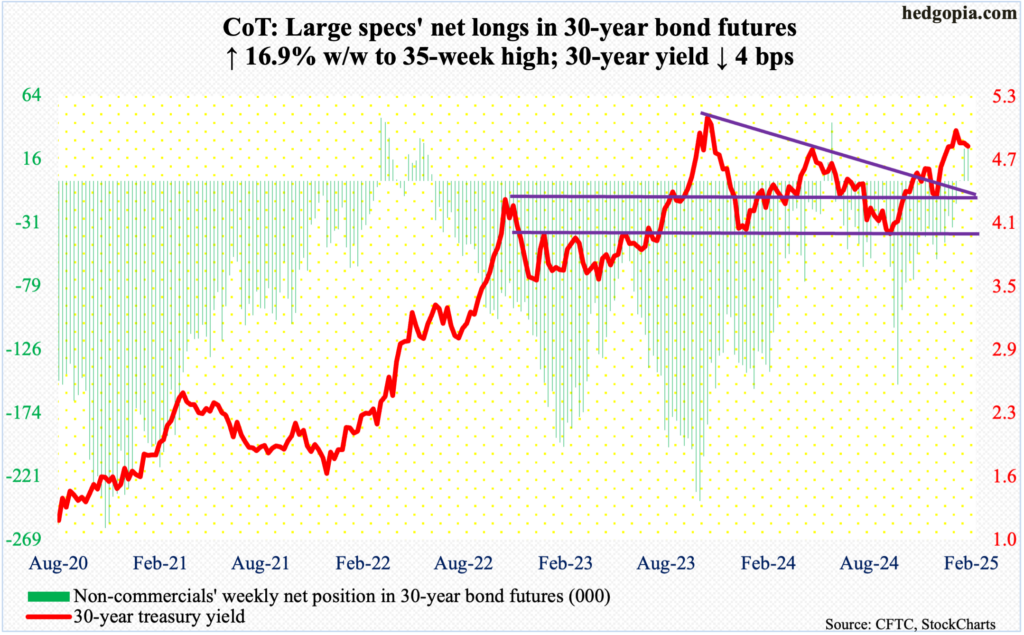
30-year bond: Currently net long 28.6k, up 4.1k.
Major US economic releases for next week are as follows.
The ISM manufacturing index (January) is on schedule for Monday. In December, manufacturing activity increased nine-tenths of a percentage point month-over-month to 49.3 percent – a nine-month high.
JOLTs job openings (December) and durable goods orders (December, revised) will be out Tuesday.
Job openings grew 259,000 m/m in November to 8.1 million. Last July, a 42-month low of 7.7 million was hit. A record high 12.2 million was posted in March 2022.
Orders for non-defense capital goods ex-aircraft – proxy for business capex plans – grew 0.5 percent m/m in December to a seasonally adjusted annual rate of $74.8 billion. This was a record.
Wednesday, the ISM services index (January) comes out. Non-manufacturing activity in December jumped two percentage points m/m to 54.1 percent. This was the sixth consecutive month of 50-plus percent.
Thursday brings labor productivity (4Q24). Non-farm output per hour rose 2.1 percent in the September quarter from a year ago. This was the slowest pace of growth in five quarters.
Payroll (January) and University of Michigan’s consumer sentiment index (February) are due out Friday.
December created 256,000 non-farm jobs, for a 2024 monthly average of 186,000, which was weaker than the 251,000 seen in 2023 and 377,000 in 2022.
Consumer sentiment slid 2.9 points m/m in January to 71.1 – a three-month low.
WTI crude oil: Currently net long 263.2k, down 53.5k.
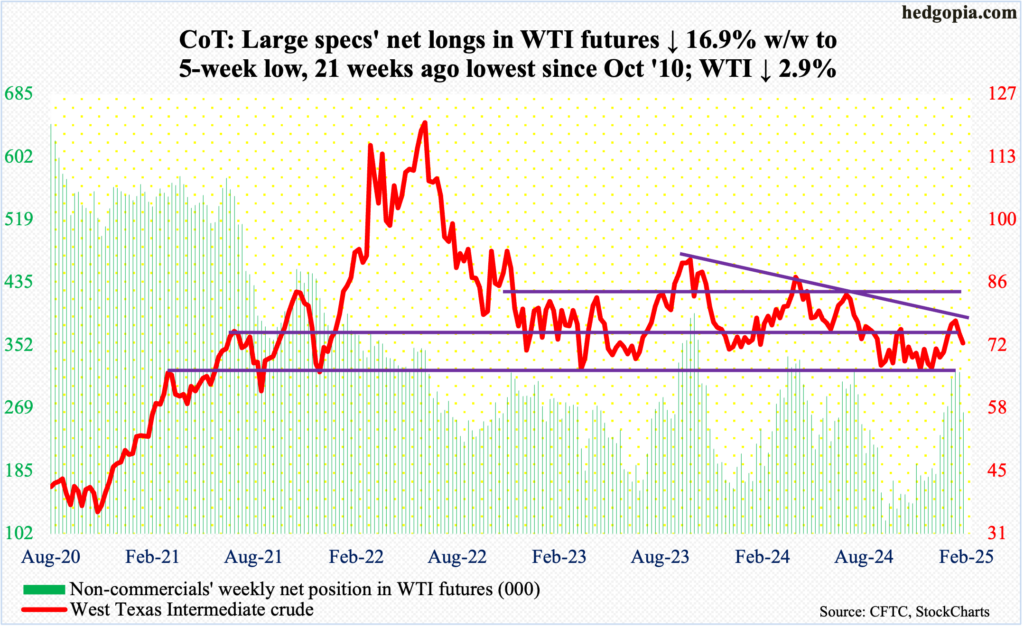
Since a shooting star week three weeks ago, which showed up after rallying for three straight weeks, West Texas Intermediate crude has been under pressure the last two weeks, with this week down 2.9 percent to $72.53/barrel.
The crude went vertical from $69.33 on December 26 to $79.33 on the 15th last month. Previously, WTI for months went back and forth between $71-$72 and $81-$82 before dropping out of the range last September. The range was recaptured as soon as 2025 began. Sellers showed up mid-January just under the range top.
The bottom of the range is once again in play. This time around, the range support also approximates the 50-day moving average at $71.63.
In the meantime, US crude production in the week to January 24 decreased 237,000 barrels per day week-over-week to 13.24 million b/d; output has come under pressure since registering a record 13.631 mb/d in the week to December 6. Crude imports, too, dropped 297,000 b/d to 6.4 mb/d. As did distillate inventory which fell five million barrels to 124 million barrels. Stocks of crude and gasoline, on the other hand, went the other way – respectively up 3.5 million barrels and three million barrels to 415.1 million barrels and 248.9 million barrels. Refinery utilization shrank 2.4 percentage points to 83.5 percent.
E-mini S&P 500: Currently net short 56.2k, down 19.6k.
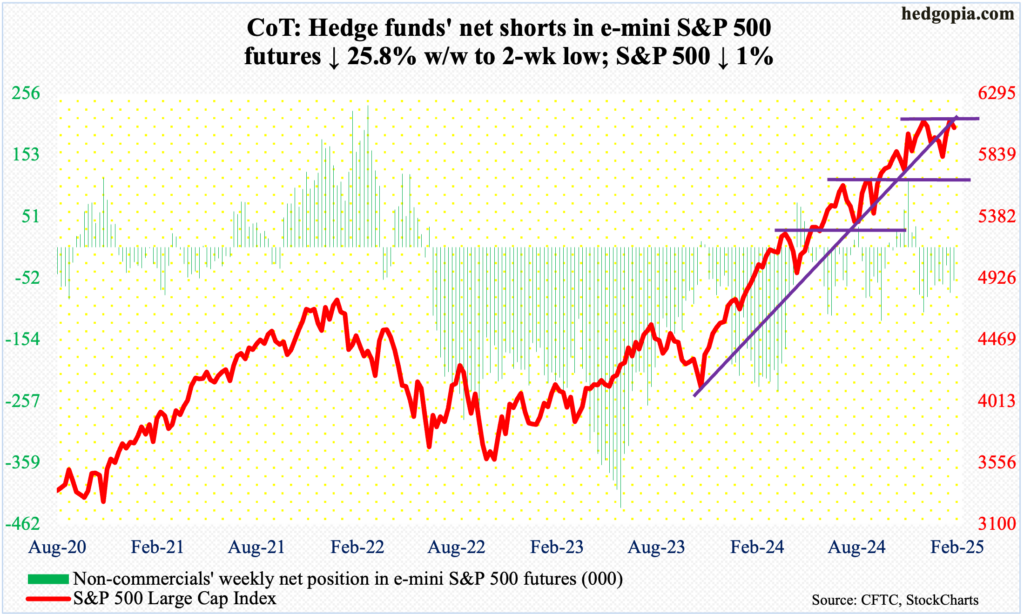
Last Friday, the S&P 500 reversed slightly lower after reaching a new intraday high of 6128. This Friday, the large cap index tested that high ticking 6121 intraday before the news of Trump tariffs sucked the wind out of the session’s positive momentum, closing at 6041, down one percent for the week. In fact, at Monday’s low (6012), it was down as much as 1.5 percent; the DeepSeek-induced weakness was bought at the 20-day, which also meant the 50-day (5990) was defended.
More weakness probably lies ahead. Friday’s failure at the prior high suggests bulls are nervous and would not mind locking in gains right here and now.
There is important horizontal support at 6010s.
Euro: Currently net short 66.6k, up 4.1k.
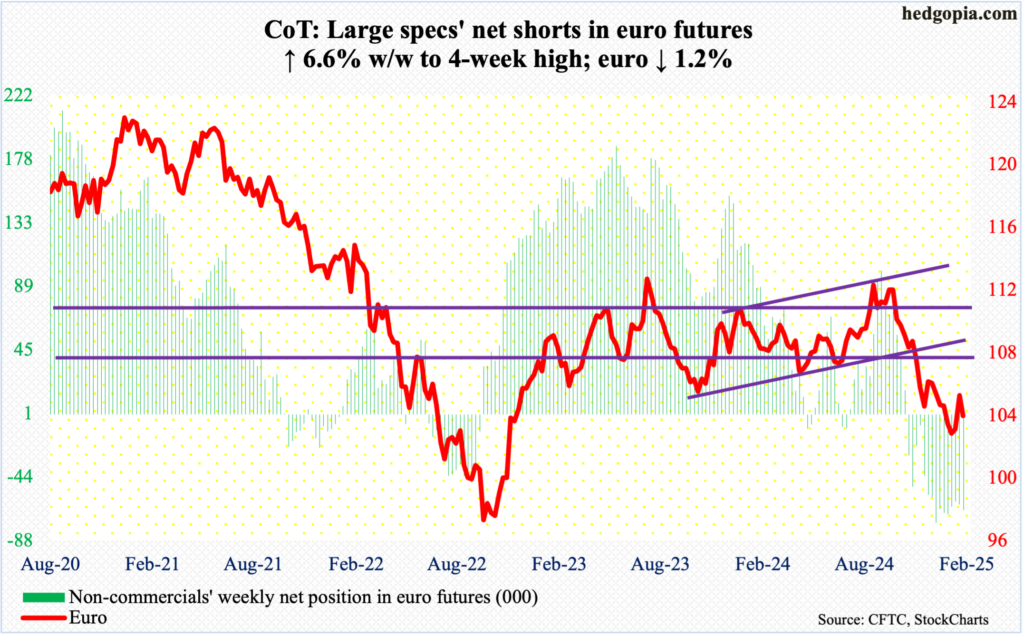
On Thursday, the European Central Bank cut the deposit rate by 25 basis points to 2.75 percent. This was the fifth cut since last June. With this, the euro continues to suffer from a wide interest-rate differential versus the greenback.
The euro fell in all five sessions this week, but not before tagging $1.0533 intraday Monday. By Friday, it dropped 1.2 percent for the week to $1.0359. Horizontal resistance at $1.05 goes back at least a decade, and it has held.
This week’s decline comes after two weeks of positive momentum. On January 13, the currency reversed higher after tagging $1.0178 intraday. Earlier, the euro fell sharply starting September 30 (last year) after facing rejection at $1.12 for six consecutive weeks.
Euro bulls can regroup near $1.03, and near last month’s low at the worst.
Gold: Currently net long 299.4k, down 1.4k.
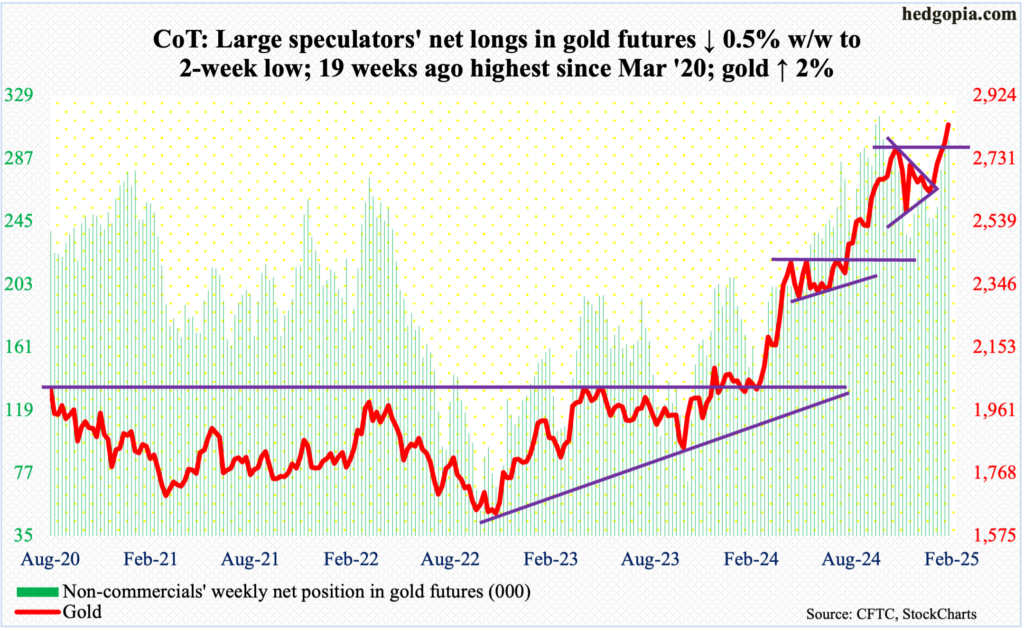
One more week and one more new high for the yellow metal!
Friday, gold peaked at $2,863 intraday before weakening to close the session at $2,835/ounce, up two percent for the week.
Gold has now rallied for five consecutive weeks. Last week, with Friday’s intraday high of $2,795, gold bugs seriously went after $2,802, which was the intraday high posted on October 30 (last year). A breakout seemed imminent, and this has happened.
The daily is extended. Immediate support lies just north of $2,800. After this, there is support at $2,750s, and $2,540s-50s and $2,440s-50s after that.
Nasdaq (mini): Currently net long 30.7k, up 12.2k.
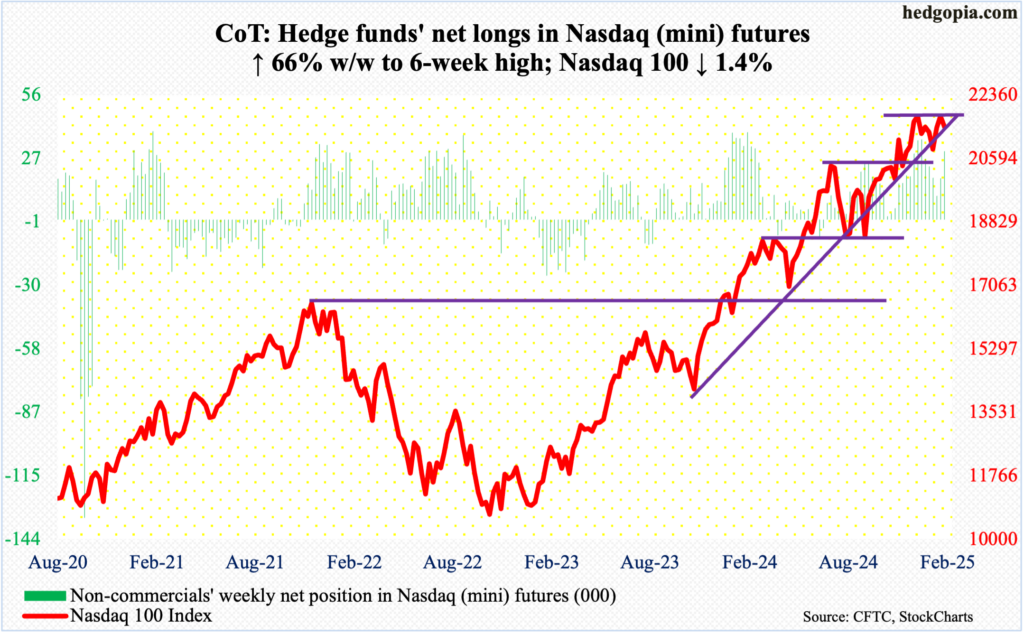
The Nasdaq 100 was unable to post a new high this week. In fact, Friday’s intraday high of 21846 was lower than last Friday’s 21945, which in turn was lower than the all-time high of 22133 posted on December 16.
The tech-heavy index dropped 1.4 percent for the week to 21478, but at Friday’s high would have been up 0.3 percent if it held. It did not, as the tariffs news hit the tape.
Next week, Google parent Alphabet (GOOG) and Amazon (AMZN) report their December quarter on Tuesday and Thursday respectively. This week, results from Tesla (TSLA) and Facebook parent Meta (META) were received favorably, while Microsoft’s (MSFT) and Apple’s (AAPL) were not.
The 50-day rests at 21293, which likely gets tested next week. If downward pressure continues, bulls’ real battle lies at 20500s, which they cannot afford to lose.
Russell 2000 mini-index: Currently net short 22k, up 1k.
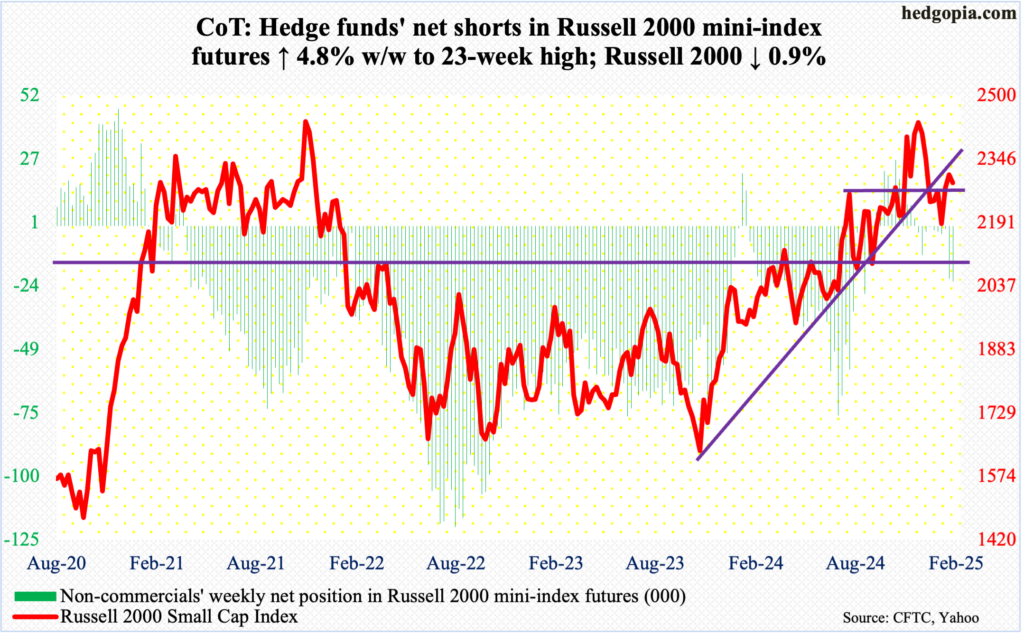
The Russell 2000 seems stuck in a rut for now.
This week, horizontal support at 2260s, which goes back to mid-July, drew bids, while 2320s, which has attracted offers for a couple of weeks now, induced selling. In the end, the small cap index gave back 0.9 percent for the week to 2287. This followed two consecutive weeks of gains.
Near term, either way it breaks – either 2260s or 2320s – momentum likely follows.
US Dollar Index: Currently net long 14.2k, down 672.
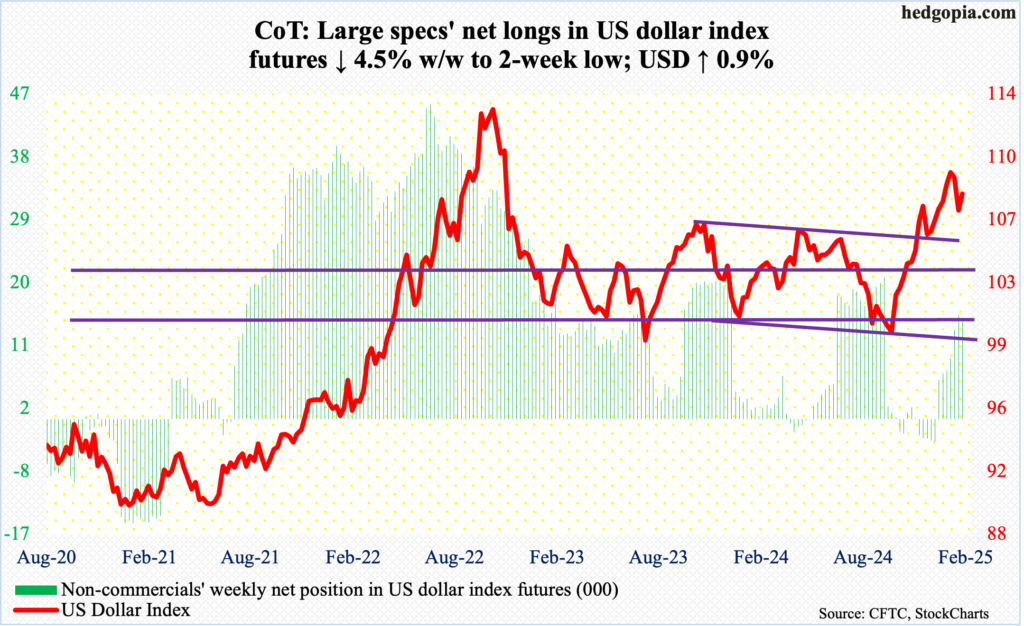
After suffering its first back-to-back down week since last September, the US dollar index turned positive this week, up 0.5 percent to 108.22.
Horizontal support at 107 was defended, although the week began with the index ticking 106.78 intraday Monday. By mid-week, bullish sentiment was helped as the FOMC expressed no rush in cutting rates.
The daily can rally further.
It has had a massive rally since September 27 when it bottomed at 99.86, after having gone sideways just under 100 for several sessions, before rallying for 14 out of 15 weeks.
There is decent resistance at 110.
VIX: Currently net short 49.4k, up 21.4k.
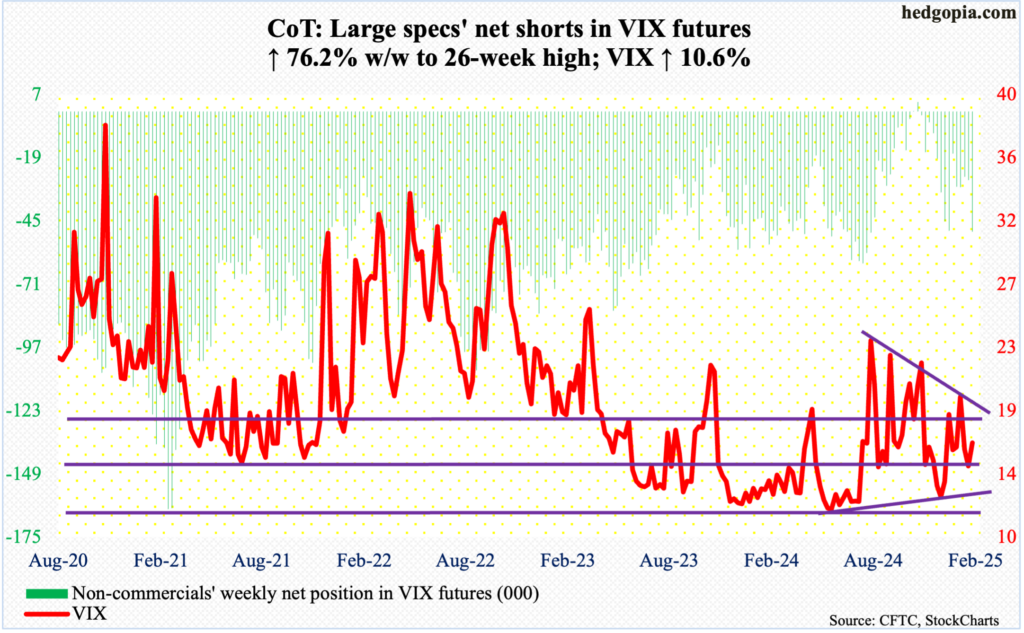
The 50- and 200-day are converging – 16.11 and 16.30 respectively – and VIX at 16.43 is right there. After two down weeks, the volatility index rallied 1.58 points this week, although intraday Monday it jumped to 22.51 but only to then reverse lower and close at 17.90.
In the event VIX comes under pressure next week, volatility bulls stand a good chance of defending 13, which is where a rising trendline from last May rests, and rally from there.
Thanks for reading!
More By This Author:
CoT: The Future Through Futures, How Hedge Funds Are Positioned, More
4Q24 Earnings Season Begins
CoT - Peek Into Future Through Futures, Hedge Fund Positions


Comments
Log in or sign up to join the conversation.