
(Click on image to enlarge)
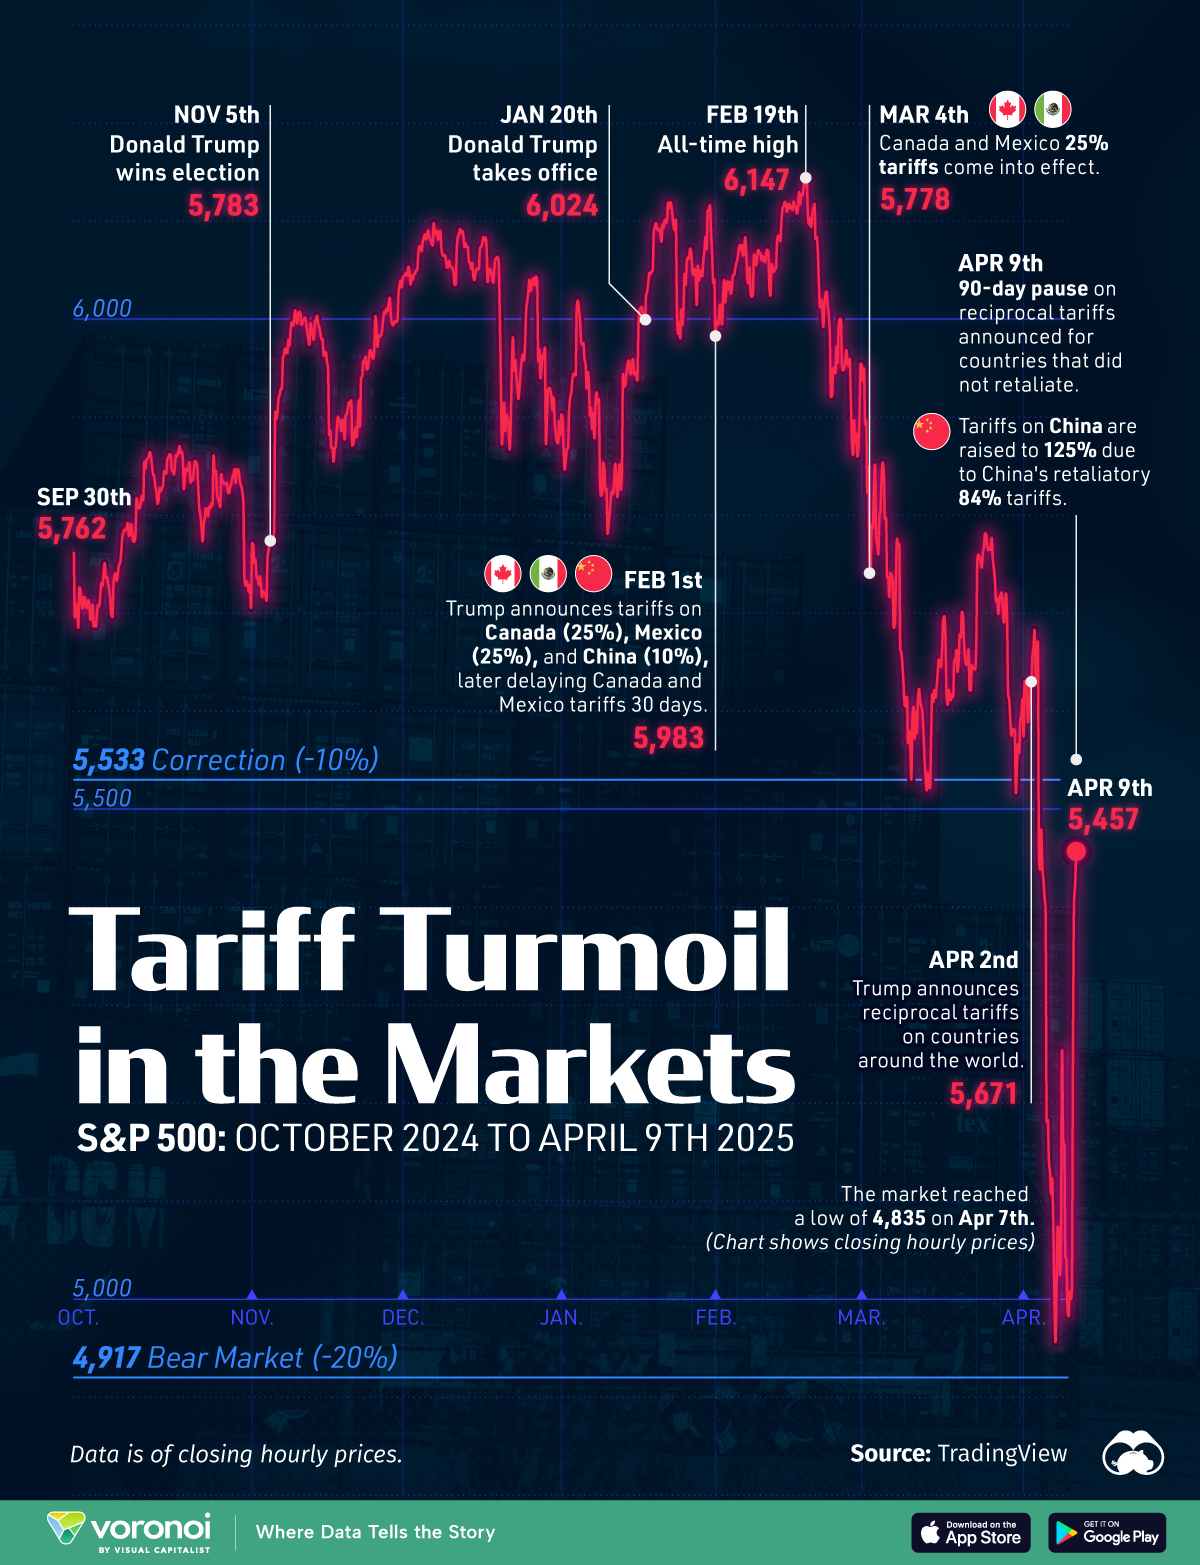
The U.S. stock market has been on a roller coaster ride since Donald Trump took office, with incredible volatility as U.S. reciprocal import tariffs were imposed and then scaled back.
This graphic charts out the S&P 500’s price from October of 2024 to April 9th, 2025 using data from TradingView, showing how markets reacted to Trump’s various tariff announcements and changes.
U.S. Stocks Reach Correction Territory
While the stock market and business world had rallied after Trump’s election victory in anticipation of a business-friendly regime, less than three months into his presidency stocks are now past correction territory (-10%).
Donald Trump’s tariff announcements, impositions, and rollbacks have seen the market fall 21% from its peak on February 19th, briefly reaching bear market territory during intraday trading on April 7th.
Below is the data of the S&P 500’s daily closing price and the decline from its all-time high on key dates.
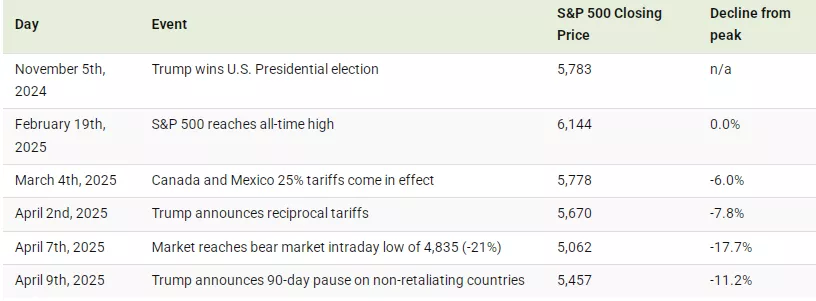
While Trump’s 90-day pause of reciprocal tariffs on non-retaliating nations resulted in a daily rally of 9.5% in the S&P 500, volatility and uncertainty persist.
Volatility, Uncertainty, and Bond Market Concerns
During the rapid decline in prices, the S&P 500’s volatility index reached a high of 60. For context, the index ranged between 12 to 22 for most of 2024 and 2025, and the high number indicates an extreme level of unease amongst market participants.
If that wasn’t enough, the U.S. bond market—typically a safe haven in times of uncertainty—has also been shaken by this tariff-induced turbulence.
Yields on the U.S. 10-year Treasury bond spiked upwards (yields rising indicate a decline in the bond’s price) from a low of 3.86% on April 7th up to 4.5%, a sharp and unexpected move considering how bonds tend to do the opposite when stocks decline.
With the Trump administration often saying they’re not looking at the stock market, and are instead looking to bring the 10-year yield down, this move could be part of what drove Trump towards pausing reciprocal tariffs two days later.
More By This Author:
Chart: The Average U.S. Tariff Rate (1890-2025)
Charted: How Microsoft Makes Its Billions
Charted: Alphabet’s Revenue Breakdown In 2024


Comments
Log in or sign up to join the conversation.