
(Click on image to enlarge)

Key Takeaways
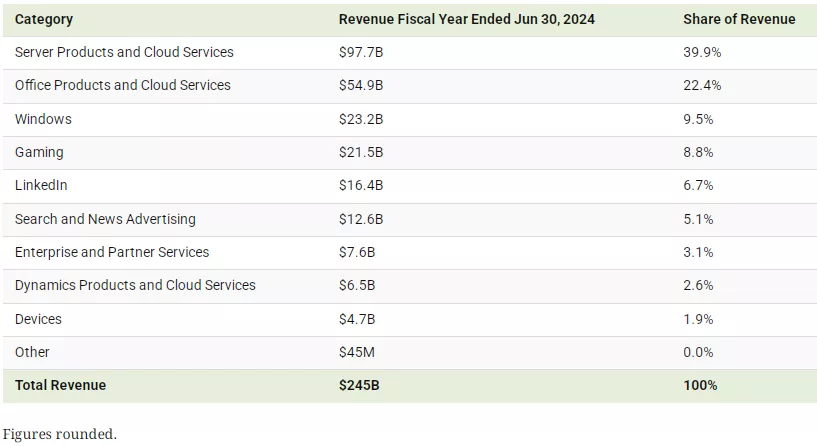
- Microsoft generates most of its revenue from its server products and cloud services division, totaling $97.7 billion in the fiscal year ending in June 2024.
- Office products and cloud services brought in $54.9 billion, increasing by roughly $10 billion since 2022.
- Gaming stood among the fastest-growing revenue sources, growing by 39% to reach $21.5 billion, driven by Xbox and Activision Blizzard sales.
With $245 billion in revenues, Microsoft (MSFT) powers its business through a wide range of revenue streams, with its flagship cloud services business driving 40% of the total.
As the world’s second-largest company by market cap, the company reported net income of $88.1 billion in 2024, posting an impressive 22% annual increase. Beyond its cloud business, gaming and office products stood as key areas of growth.
This graphic shows Microsoft revenues in the fiscal year ending in June 2024, based on data from its 10-K annual report.
Microsoft Revenues Climb to $245 Billion
Below, we show how Microsoft’s revenue is fueled by 10 business segments driving sales 16% higher over the year:
More By This Author:
Charted: Alphabet’s Revenue Breakdown In 2024Charted: How Does Meta Make Money?
Charted: How Nvidia Makes Its $131 Billion In Revenue


Comments
Log in or sign up to join the conversation.