
Doesn’t look like a recession in that month, nor in the previous.
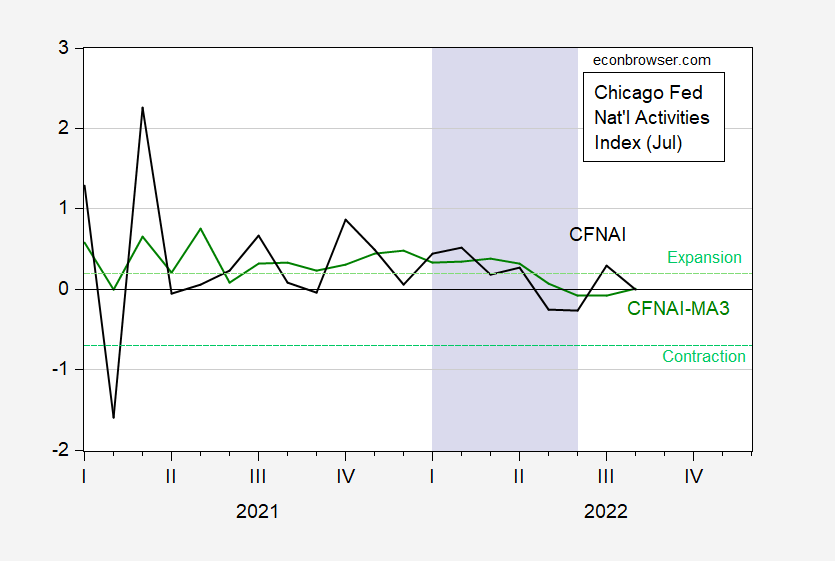
Figure 1: CFNAI, in standard deviation units (blue), CFNAI 3 month moving average (green). CFNAI normalized at 0 for trend growth rate. Green dashed line denotes threshold for expansion after period of contraction, and contraction after a period of expansion, for CFNAI 3 month MA. Lilac shading denotes a hypothetical H1 recession. Source: Chicago Fed, August release.
The three-month trailing moving average is very slightly above zero, indicating growth at historical trend growth. It is far above the level consistent with contraction (i.e., recession). The CFNAI-MA3 tracks pretty well with NBER-defined recessions (see the Chicago Fed website for the requisite graphs), except for the 2007 recession, where the CFNAI-MA3 passes the threshold in April 2008 (rather than Jan 2008, the month after the NBER-defined peak).
In fact, CFNAI 3-month moving average has been above the contraction threshold for the entire period shown in the graph, so — contra some observers’ assertions — I don’t see a recession in the first half of 2022, nor as of August. This point is further reinforced by the CFNAI diffusion index.
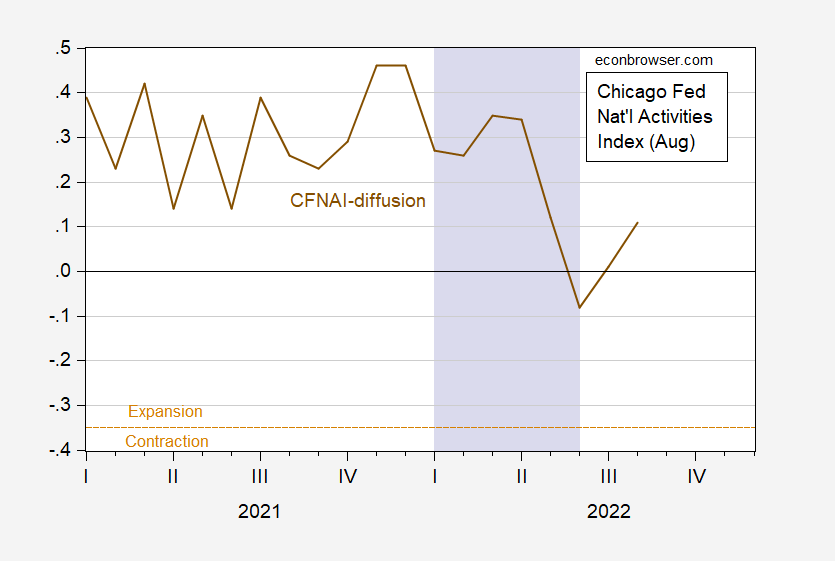
Figure 2: CFNAI diffusion (brown). Below tan dashed line indicates contraction, above indicates expansion. Lilac shading denotes a hypothetical H1 recession. Source: Chicago Fed, August release.
The diffusion index is also above the level consistent with contraction, after a period of expansion. This measure also works pretty well, with the exception of signaling a recession start in December 2000 rather than the NBER contraction starting in April 2001.
Hence, the CFNAI, a weighted average of 85 indicators of economic activity (described here), suggests we are not as of August 2022, nor have we within the past year, been in a recession.
More By This Author:
Weekly Economic Activity In The UK, And Two Self-Inflicted WoundsTracking The Euro Area At High Frequency
US, Euro Area And China GDP Over The Pandemic And Recovery


Comments
Log in or sign up to join the conversation.